Kubernetes Logging
1. Kubernetes Logging
In a Kubernetes cluster, logs should have a separate storage and lifecycle independent of nodes, pods, or containers, that is called cluster-level logging. [1]
1.1. Pod and container logs
Kubernetes captures logs from each container in a running Pod.
# debug/counter-pod.yaml
apiVersion: v1
kind: Pod
metadata:
  name: counter
spec:
  containers:
  - name: count
    image: busybox:1.28
    args: [/bin/sh, -c,
            'i=0; while true; do echo "$i: $(date)"; i=$((i+1)); sleep 1; done']
To run this pod, use the following command:
kubectl apply -f https://k8s.io/examples/debug/counter-pod.yamlTo fetch the logs, use the kubectl logs command, as follows:
# kubectl logs [--previous] counter [-c count] [-f] [--tail 10]
kubectl logs counter
627: Sun Mar 3 06:29:05 UTC 2024
628: Sun Mar 3 06:29:06 UTC 2024
629: Sun Mar 3 06:29:07 UTC 2024
630: Sun Mar 3 06:29:08 UTC 2024
631: Sun Mar 3 06:29:09 UTC 20241.2. How nodes handle container logs
A container runtime handles and redirects any output generated to a containerized application’s stdout and stderr streams.
-
Different container runtimes implement this in different ways; however, the integration with the kubelet is standardized as the CRI logging format.
-
By default, if a container restarts, the kubelet keeps one terminated container with its logs.
-
If a pod is evicted from the node, all corresponding containers are also evicted, along with their logs.
1.3. Log locations and format
On Linux nodes that use systemd, the kubelet and container runtime write to journald by default.
For components that run in pods, these write to files inside the /var/log directory,and the kubelet always directs the container runtime to write logs into directories within /var/log/pods.
$ sudo ls -l /var/log/{containers,pods}
/var/log/containers:
total 116
... coredns-7b44686977-vlt44_kube-system_coredns-7...a.log -> /var/log/pods/kube-system_coredns-7b44686977-vlt44_36dc81bd-f2eb-4870-be75-330cb10f61ab/coredns/0.log
... coredns-7b44686977-z9mwq_kube-system_coredns-3...e.log -> /var/log/pods/kube-system_coredns-7b44686977-z9mwq_236098b7-9988-4c29-9498-041f95b3393d/coredns/0.log
... counter_default_count-4...f.log -> /var/log/pods/default_counter_5b0efb65-38fe-47f4-9d8d-dba07f9038b8/count/0.log

/var/log/pods:
total 80
... default_counter_5b0efb65-38fe-47f4-9d8d-dba07f9038b8
... kube-system_coredns-7b44686977-vlt44_36dc81bd-f2eb-4870-be75-330cb10f61ab
... kube-system_coredns-7b44686977-z9mwq_236098b7-9988-4c29-9498-041f95b3393d

$ sudo tree /var/log/pods/
/var/log/pods/
├── default_counter_5b0efb65-38fe-47f4-9d8d-dba07f9038b8
│   └── count
│       └── 0.log
...-
The containers logs under
/var/log/containersare with pod and container metadata embedded in the filename:/var/log/containers/<pod_name>_<pod_namespace>_<container_name>-<container_id>.log. [2] -
The the pod-level log directory
/var/log/podsstore all container logs with the format:/var/log/pods/<podUID>/<containerName>_<instance#>.log. [2] -
The each log entry is decorated with a RFC 3339Nano timestamp prefix, the stream type (i.e., "stdout" or "stderr"), the tags of the log entry, the log content that ends with a newline. [2]
2016-10-06T00:17:09.669794202Z stdout F The content of the log entry 1
2016-10-06T00:17:09.669794202Z stdout P First line of log entry 2
2016-10-06T00:17:09.669794202Z stdout P Second line of the log entry 2
2016-10-06T00:17:10.113242941Z stderr F Last line of the log entry 2
Use crictl to determine the log path of containers.
-
List pods filtered by pod name:
$ sudo crictl pods --name counter POD ID CREATED STATE NAME NAMESPACE ATTEMPT RUNTIME 9509134c36363 15 minutes ago Ready counter default 0 (default) 4246eaf3effc6 8c811b4aec35f 17 minutes ago Running count 0 9509134c36363 counter -
Show the pod-level log directory:
$ sudo crictl inspectp -o go-template --template '{{.info.config.log_directory}}' 9509134c36363 /var/log/pods/default_counter_5b0efb65-38fe-47f4-9d8d-dba07f9038b8 -
List containers filtered by pod id:
$ sudo crictl ps --pod 9509134c36363 CONTAINER IMAGE CREATED STATE NAME ATTEMPT POD ID POD 4246eaf3effc6 8c811b4aec35f 34 minutes ago Running count 0 9509134c36363 counter -
Show the log path of a container:
$ sudo crictl inspect -o go-template --template '{{.status.logPath}}' 4246eaf3effc6 /var/log/pods/default_counter_5b0efb65-38fe-47f4-9d8d-dba07f9038b8/count/0.log -
Show the log content of a container:
$ sudo tail -n 3 /var/log/pods/default_counter_5b0efb65-38fe-47f4-9d8d-dba07f9038b8/count/0.log
2024-03-03T16:23:26.644901904+08:00 stdout F 2330: Sun Mar  3 08:23:26 UTC 2024
2024-03-03T16:23:27.647833675+08:00 stdout F 2331: Sun Mar  3 08:23:27 UTC 2024
2024-03-03T16:23:28.650085015+08:00 stdout F 2332: Sun Mar  3 08:23:28 UTC 2024
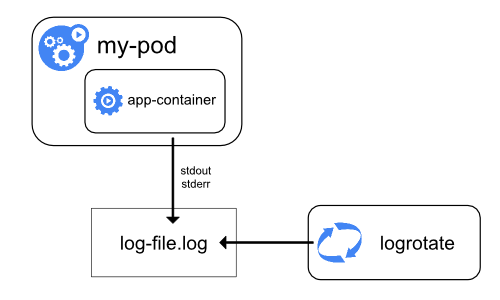
1.4. Cluster-level logging architectures
While Kubernetes does not provide a native solution for cluster-level logging, there are several common approaches you can consider. Here are some options: [1]
-
Use a node-level logging agent that runs on every node.
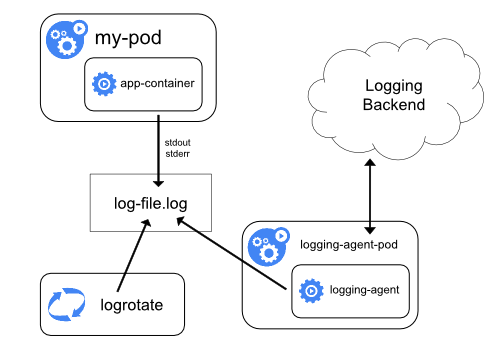
-
Include a dedicated sidecar container for logging in an application pod.
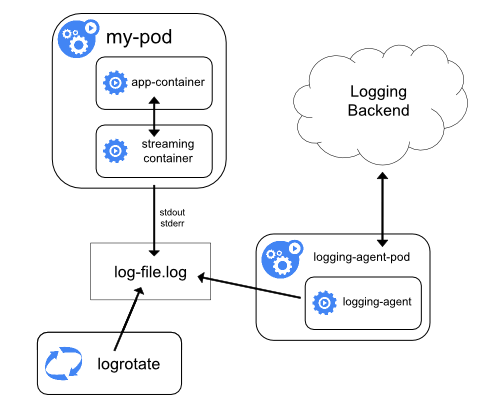
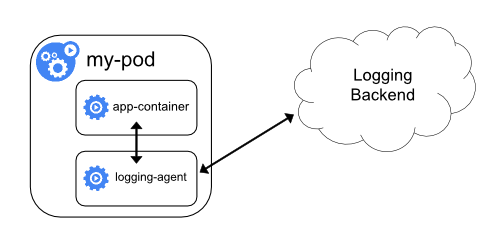
-
Push logs directly to a backend from within an application.
2. What is Fluent Bit?
Fluent Bit is a Fast and Lightweight is a Fast and Lightweight Telemetry Agent for Logs, Metrics, and Traces, which is a CNCF sub-project under the umbrella of Fluentd. [3]
| Fluentd | Fluent Bit | |
|---|---|---|
Scope |
Containers / Servers |
Embedded Linux / Containers / Servers |
Language |
C & Ruby |
C |
Memory |
> 60MB |
~ 1MB |
Performance |
Medium Performance |
High Performance |
Dependencies |
Built as a Ruby Gem, it requires a certain number of gems. |
Zero dependencies, unless some special plugin requires them. |
Plugins |
More than 1000 external plugins available |
Around 100 built-in plugins available |
License |
Every incoming piece of data that belongs to a log or a metric that is retrieved by Fluent Bit is considered an Event or a Record, represented as a 2-element array with a nested array as the first element: [[TIMESTAMP, METADATA], MESSAGE].
docker run --rm  \
    fluent/fluent-bit:2.2 \
    -q \
    -i dummy \
    -p 'tag=dummy.data' \
    -p 'samples=3' \
    -p 'dummy={"data":"100 0.5 true This is example"}' \
    -o stdout
[0] dummy.data: [[1709527380.566845126, {}], {"data"=>"100 0.5 true This is example"}]
[0] dummy.data: [[1709527381.561442519, {}], {"data"=>"100 0.5 true This is example"}]
[0] dummy.data: [[1709527382.561138285, {}], {"data"=>"100 0.5 true This is example"}]|
Fluent Bit versions prior to v2.1.0 instead used |
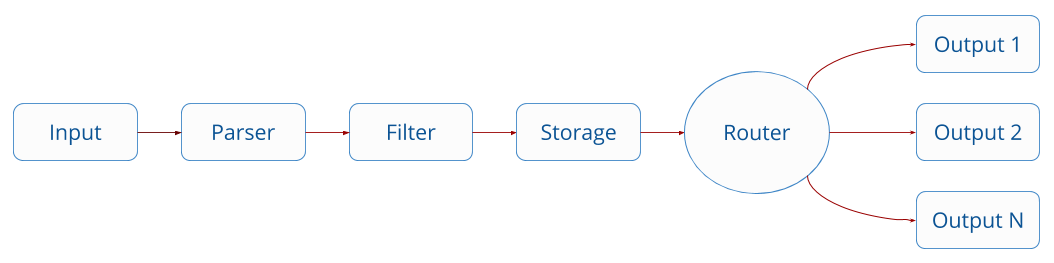
Fluent Bit collects and process logs (records) from different input sources and allows to parse and filter these records before they hit the Storage interface. Once data is processed and it’s in a safe state (either in memory or the file system), the records are routed through the proper output destinations. [4]
2.1. Configuring
Fluent Bit supports two configuration formats, Classic mode and Yaml.
A simple example of a classic mode configuration file is as follows: [5]
[SERVICE]
    # This is a commented line
    daemon    off
    log_level debug
The schema is defined by three concepts:
-
Sections
A section is defined by a name or title inside brackets, e.g.,
[SERVICE].-
All section content must be indented (4 spaces ideally).
-
Multiple sections can exist on the same file.
-
A section is expected to have comments and entries, it cannot be empty.
-
Any commented line under a section, must be indented too.
-
End-of-line comments are not supported, only full-line comments.
-
-
Entries: Key/Value
A section may contain Entries, an entry is defined by a line of text that contains a
Keyand aValue.-
An entry is defined by a key and a value.
-
A key must be indented.
-
A key must contain a value which ends in the breakline.
-
Multiple keys with the same name can exist.
Also commented lines are set prefixing the
#character, those lines are not processed but they must be indented too.
-
-
Indented Configuration Mode
Fluent Bit configuration files are based in a strict Indented Mode, that means that each configuration file must follow the same pattern of alignment from left to right when writing text.
The following example demonstrates how to use a main configuration file to generate and output dummy events:
# fluent-bit.conf
[SERVICES]
    flush     1
    daemon    off

[INPUT]
    name        dummy
    tag         dumy.data
    samples     3
    dummy       {"data":"100 0.5 true This is example"}

[OUTPUT]
    name    stdout
    match   *
docker run --rm \
-v $PWD/fluent-bit.conf:/etc/fluent-bit/fluent-bit.conf fluent/fluent-bit:2.2 \
-q \
-c /etc/fluent-bit/fluent-bit.conf[0] dumy.data: [[1709531349.562834986, {}], {"data"=>"100 0.5 true This is example"}]
[0] dumy.data: [[1709531350.561133286, {}], {"data"=>"100 0.5 true This is example"}]
[0] dumy.data: [[1709531351.561125139, {}], {"data"=>"100 0.5 true This is example"}]2.2. Multiline Parsing
In an ideal world, applications might log their messages within a single line, but in reality applications generate multiple log messages that sometimes belong to the same context, like stack traces. [6]
The Multiline parser engine exposes two ways to configure and use the functionality:
-
Without any extra configuration, Fluent Bit exposes certain pre-configured parsers (built-in) to solve specific multiline parser cases, e.g:
docker,cri. -
A multiline parser is defined in a parsers configuration file by using a
[MULTILINE_PARSER]section definition.
| It is not possible to get the time key from the body of the multiline message. However, it can be extracted and set as a new key by using a filter. |
| If you wish to concatenate messages read from a log file, it is highly recommended to use the multiline support in the Tail plugin itself. [7] |
2.3. Parsers
Parsers can be used to take any unstructured log entry and give them a structure that makes easier it processing and further filtering. [8]
The parser engine is fully configurable and can process log entries based in two types of format:
-
Regular Expressions (named capture)
All parsers must be defined in a parsers.conf file, not in the Fluent Bit global configuration file. The parsers file expose all parsers available that can be used by the Input plugins that are aware of this feature.
For more information about the parsers available, please refer to the default parsers file distributed with Fluent Bit source code: https://github.com/fluent/fluent-bit/blob/v2.2.2/conf/parsers.conf.
2.4. Parser Filter
Filtering is implemented through plugins, used to match, exclude or enrich logs with some specific metadata. [9]
The Parser Filter plugin allows for parsing fields in event records, which supports the following configuration parameters:
| Key | Description | Default |
|---|---|---|
|
Specify field name in record to parse. |
|
|
Specify the parser name to interpret the field. Multiple Parser entries are allowed (one per line). |
|
|
Keep original |
|
|
Keep all other original fields in the parsed result. If false, all other original fields will be removed. |
|
|
If the key is an escaped string (e.g: stringify JSON), unescape the string before applying the parser. |
|
The following is an example of parsing a record {"data":"100 0.5 true This is example"}.
# parsers.conf
[PARSER]
    name dummy_test
    format regex
    regex ^(?<INT>[^ ]+) (?<FLOAT>[^ ]+) (?<BOOL>[^ ]+) (?<STRING>.+)$
# fluent-bit-with-parsers.conf
[SERVICE]
parsers_file parsers.conf
[INPUT]
name dummy
tag dummy.data
dummy {"data":"100 0.5 true This is example"}
samples 3
[FILTER]
name parser
match dummy.*
key_name data
parser dummy_test
[OUTPUT]
name stdout
match *The output after parser filtering is:
#!/bin/sh
docker run --rm \
  -v $PWD/fluent-bit-with-parsers.conf:/etc/fluent-bit/fluent-bit.conf \
  -v $PWD/parsers.conf:/etc/fluent-bit/parsers.conf \
  fluent/fluent-bit:2.2 \
  -q \
  -c /etc/fluent-bit/fluent-bit.conf
[0] dummy.data: [[1709535476.570488151, {}], {"INT"=>"100", "FLOAT"=>"0.5", "BOOL"=>"true", "STRING"=>"This is example"}]
[0] dummy.data: [[1709535477.573640185, {}], {"INT"=>"100", "FLOAT"=>"0.5", "BOOL"=>"true", "STRING"=>"This is example"}]
[0] dummy.data: [[1709535478.575603024, {}], {"INT"=>"100", "FLOAT"=>"0.5", "BOOL"=>"true", "STRING"=>"This is example"}]2.5. Kubernetes Filter
When Fluent Bit is deployed in Kubernetes as a DaemonSet and configured to read the log files from the containers (using tail or systemd input plugins), this filter aims to perform the following operations: [10]
-
Analyze the Tag and extract the metdata: Pod Name, Namespace, Container Name, Container ID.
-
Query Kubernetes API Server to obtain extra metadata for the PID in question: Pod ID, Labels, Annotations.
A flexible feature of Fluent Bit Kubernetes filter is that allow Kubernetes Pods to suggest certain behaviors for the log processor pipeline when processing the records. At the moment it support:
-
fluentbit.io/parser[_stream][-container]Suggest a pre-defined parser. The parser must be registered already by Fluent Bit. This option will only be processed if Fluent Bit configuration (Kubernetes Filter) have enabled the option K8S-Logging.Parser. If present, the stream (stdout or stderr) will restrict that specific stream. If present, the container can override a specific container in a Pod.
Set K8S-Logging.Parser: Onto allow Kubernetes Pods to suggest a pre-defined Parser. -
fluentbit.io/exclude[_stream][-container]Request to Fluent Bit to exclude or not the logs generated by the Pod. This option will only be processed if Fluent Bit configuration (Kubernetes Filter) have enabled the option
K8S-Logging.Exclude. Default is False.Set K8S-Logging.Exclude: Onto allow Kubernetes Pods to exclude their logs from the log processor.
3. Kubernetes
Fluent Bit is a lightweight and extensible Log Processor that comes with full support for Kubernetes: [11]
-
Process Kubernetes containers logs from the file system or Systemd/Journald.
-
Enrich logs with Kubernetes Metadata.
-
Centralize your logs in third party storage services like Elasticsearch, InfluxDB, HTTP, etc.
Kubernetes Filter depends on either Tail and Systemd input plugins to process and enrich records with Kubernetes metadata. [10]
Fluent Bit Kubernetes filter has an optional feature flag Use_Kubelet to send the request to kubelet /pods endpoint instead of kube-apiserver to retrieve the pods information and use it to enrich the log.
|
[INPUT]
    name              tail
    tag               kube.*
    path              /var/log/containers/*.log
    #exclude_path      /var/log/containers/*_logging_*.log,/var/log/containers/*_default*.log
    multiline.parser  cri,docker
    db                /var/log/flb_kube.db
    mem_buf_limit     5MB
    skip_long_lines   on
    refresh_interval  10

[INPUT]
    name              systemd
    tag               host.*
    db                /var/log/flb_host.db
    systemd_filter    _SYSTEMD_UNIT=docker.service
    systemd_filter    _SYSTEMD_UNIT=containerd.service
    systemd_filter    _SYSTEMD_UNIT=kubelet.service
    strip_underscores on

[FILTER]
    name                kubernetes
    match               kube.*
    kube_url            https://kubernetes.default.svc:443
    kube_ca_file        /var/run/secrets/kubernetes.io/serviceaccount/ca.crt
    kube_token_file     /var/run/secrets/kubernetes.io/serviceaccount/token
    kube_tag_prefix     kube.var.log.containers.
    annotations         off
    merge_log           on
    #merge_log_key      merge_log
    k8s-logging.parser  off
    k8s-logging.exclude off
Role Configuration for Fluent Bit DaemonSet Example:
---
apiVersion: v1
kind: ServiceAccount
metadata:
  name: fluentbitds
  namespace: fluentbit-system
---
apiVersion: rbac.authorization.k8s.io/v1
kind: ClusterRole
metadata:
  name: fluentbit
rules:
  - apiGroups: [""]
    resources:
      - namespaces
      - pods
      # The difference is that kubelet need a special permission
      # for resource `nodes/proxy` to get HTTP request in.
      - nodes
      - nodes/proxy
    verbs:
      - get
      - list
      - watch
---
apiVersion: rbac.authorization.k8s.io/v1
kind: ClusterRoleBinding
metadata:
  name: fluentbit
roleRef:
  apiGroup: rbac.authorization.k8s.io
  kind: ClusterRole
  name: fluentbit
subjects:
  - kind: ServiceAccount
    name: fluentbitds
    namespace: fluentbit-system
DaemonSet config Example:
---
apiVersion: apps/v1
kind: DaemonSet
metadata:
  name: fluentbit
  namespace: fluentbit-system
  labels:
    app.kubernetes.io/name: fluentbit
spec:
  selector:
    matchLabels:
      name: fluentbit
  template:
    metadata:
      labels:
        name: fluentbit
    spec:
      serviceAccountName: fluentbitds
      containers:
        - name: fluent-bit
          imagePullPolicy: Always
          image: fluent/fluent-bit:latest
          volumeMounts:
            - name: varlog
              mountPath: /var/log
            - name: varlibdockercontainers
              mountPath: /var/lib/docker/containers
              readOnly: true
            - name: fluentbit-config
              mountPath: /fluent-bit/etc/
          resources:
            limits:
              memory: 1500Mi
            requests:
              cpu: 500m
              memory: 500Mi
      # The key point is to set `hostNetwork` to `true` and
      # `dnsPolicy` to `ClusterFirstWithHostNet` that fluent
      # bit DaemonSet could call Kubelet locally.
      hostNetwork: true
      dnsPolicy: ClusterFirstWithHostNet
      volumes:
        - name: varlog
          hostPath:
            path: /var/log
        - name: varlibdockercontainers
          hostPath:
            path: /var/lib/docker/containers
        - name: fluentbit-config
          configMap:
name: fluentbit-config| There is also a logging solution based on EFK (Elastic Search, Fluent Bit, Kibana) for Kubernetes on GitHub. |
References
-
[1] https://kubernetes.io/docs/concepts/cluster-administration/logging/
-
[2] https://github.com/kubernetes/design-proposals-archive/blob/main/node/kubelet-cri-logging.md
-
[4] https://docs.fluentbit.io/manual/stream-processing/overview
-
[5] https://docs.fluentbit.io/manual/administration/configuring-fluent-bit/classic-mode/format-schema
-
[6] https://docs.fluentbit.io/manual/administration/configuring-fluent-bit/multiline-parsing
-
[7] https://docs.fluentbit.io/manual/pipeline/filters/multiline-stacktrace
-
[8] https://docs.fluentbit.io/manual/pipeline/parsers/configuring-parser
-
[9] https://docs.fluentbit.io/manual/concepts/data-pipeline/filter
-
[10] https://docs.fluentbit.io/manual/pipeline/filters/kubernetes
-
[11] https://docs.fluentbit.io/manual/installation/kubernetes