| For the cluster-wide logging solution on Kubernetes, see post at Kubernetes Logging |
1. What is the ELK/EFK Stack?
ELK is the arconym for three open source projects: Elasticsearch, Logstash, and Kibana.
-
Elasticsearch is a search and analytics engine.
-
Logstash is a server-side data processing pipeline that ingests data from multiple sources simultaneously, tranforms it, and then sends it to a "stash" like Elasticsearch.
-
Kibana lets users visualize data with charts and graphs in Elasticsearch.
EFK is the arconym for Elasticsearch, Fluent Bit (or Fluentd, Filebeat etc.), Kibana.
2. What is the Fluentd?


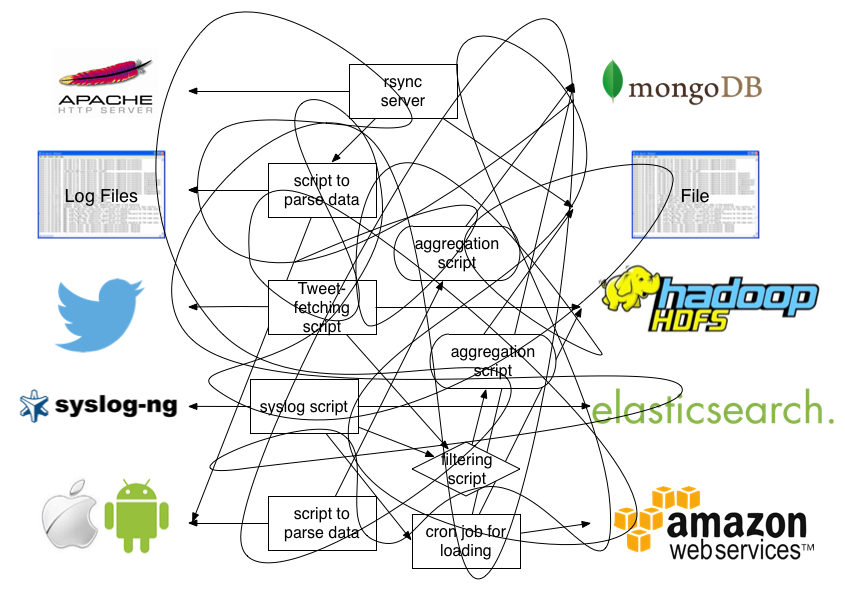
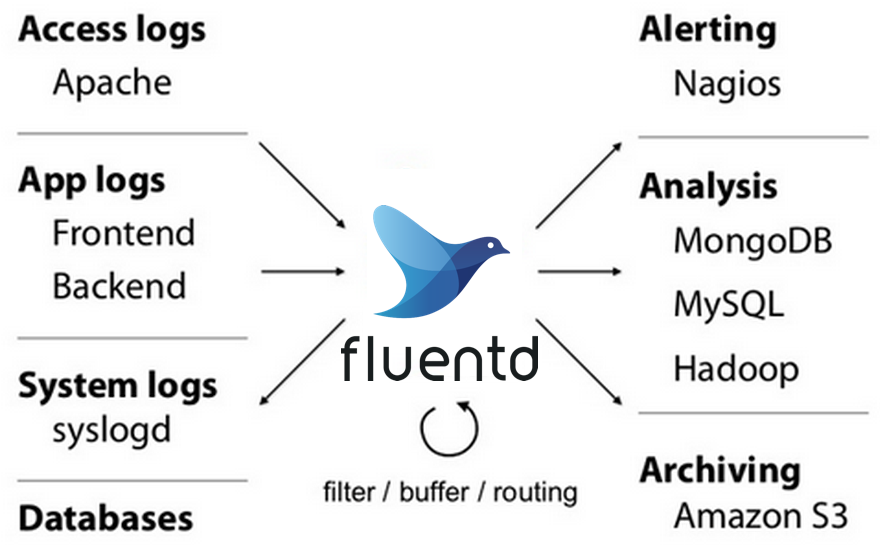
Fluentd is an open source data collector, which lets you unify the data collection and consumption for a better use and understanding of data.
3. What is Fluent Bit?
Fluent Bit is an open source and multi-platform log processor tool which aims to be a fast and lightweight generic Swiss knife for logs processing and distribution.
Fluent Bit is a CNCF sub-project under the umbrella of Fluentd, it’s licensed under the terms of the Apache License v2.0. The project was originally created by Treasure Data and is currently a vendor neutral and community driven project.
Logging and data processing in general can be complex, and at scale a bit more, that’s why it was born.
Fluentd has become more than a simple tool, it has grown into a fullscale ecosystem that contains SDKs for different languages and sub-projects like Fluent Bit.
Both projects share a lot of similarities, Fluent Bit is fully designed and built on top of the best ideas of Fluentd architecture and general design. Choosing which one to use depends on the end-user needs.
The following table describes a comparison in different areas of the projects:
| Fluentd | Fluent Bit | |
|---|---|---|
Scope |
Containers / Servers |
Embedded Linux / Containers / Servers |
Language |
C & Ruby |
C |
Memory |
~40MB |
~650KB |
Performance |
High Performance |
High Performance |
Dependencies |
Built as a Ruby Gem, it requires a certain number of gems. |
Zero dependencies, unless some special plugin requires them. |
Plugins |
More than 1000 plugins available |
Around 70 plugins available |
License |
Both Fluentd and Fluent Bit can work as Aggregators or Forwarders, they both can complement each other or use them as standalone solutions.
Fluent Bit collects and process logs from different input sources and allows to parse and filter these records before they hit the Storage interface. Once data is processed and it’s in a safe state (either in memory or the file system), the records are routed through the proper output destinations.

4. Collect Docker logs with EFK Stack
Starting from Docker v1.8, it provides a Fluentd Logging Driver which implements the Forward protocol. Fluent Bit have native support for this protocol, so it can be used as a lightweight log collector.
Talk is cheap, show me the code @ https://github.com/ousiax/efk-docker/tree/oss-7.10.2
$ tree
.
├── conf
│   ├── fluent-bit.conf
│   └── parsers.conf
├── docker-compose.yml
├── LICENSE
└── README.md

1 directory, 5 filesversion: "2.4"
services:
elasticsearch:
image: docker.elastic.co/elasticsearch/elasticsearch-oss:7.10.2
restart: on-failure
mem_limit: 2g
environment:
- discovery.type=single-node
ports:
- 9200
volumes:
- /var/lib/elasticsearch:/usr/share/elasticsearch/data
networks:
- local
depends_on:
- fluent-bit
logging:
driver: fluentd
options:
tag: efk.es
kibana:
image: docker.elastic.co/kibana/kibana-oss:7.10.2
restart: on-failure
mem_limit: 256m
environment:
- ELASTICSEARCH_HOSTS=http://elasticsearch:9200
ports:
- 5601:5601
networks:
- local
depends_on:
- fluent-bit
- elasticsearch
logging:
driver: fluentd
options:
tag: efk.kibana
fluent-bit:
image: fluent/fluent-bit:1.8
command:
- /fluent-bit/bin/fluent-bit
- --config=/etc/fluent-bit/fluent-bit.conf
environment:
- FLB_ES_HOST=elasticsearch
- FLB_ES_PORT=9200
ports:
#- 2020:2020
- 24224:24224
volumes:
- ./conf/:/etc/fluent-bit/:ro
networks:
- local
logging:
driver: fluentd
options:
tag: efk.fluent-bit
networks:
local:
driver: bridge[SERVICE]
flush 5
daemon off
http_server on
log_level info
parsers_file parsers.conf
[INPUT]
Name forward
Listen 0.0.0.0
Port 24224
[FILTER]
name parser
match efk.*
key_name log
parser json
reserve_data true
[OUTPUT]
name es
match *
host ${FLB_ES_HOST}
port ${FLB_ES_PORT}
replace_dots on
retry_limit false
logstash_format on
logstash_prefix fluent-bit[PARSER]
name json
format json
time_key time
time_format %d/%b/%Y:%H:%M:%S %z
[PARSER]
name docker
format json
time_key time
time_format %Y-%m-%dT%H:%M:%S.%L
time_keep On|
By default, Elasticsearch runs inside the container as user If you are bind-mouting a local directory or file, ensure it is readable by this user, while the data and log dirs additionally require write access. A good strategy is to grant group access to gid For more information, see Configuration files must be readable by the elasticsearch user |
Now let’s create host path for ES data directory and start our EFK services.
-
Create ES data directory.
$ sudo mkdir /var/lib/elasticsearch $ sudo chown 1000 /var/lib/elasticsearch $ sudo ls -ldn /var/lib/elasticsearch drwxr-xr-x 2 1000 0 4096 Jan 11 17:53 /var/lib/elasticsearch -
Use
docker-composeto start services-
Fluent Bit Test
$ docker-compose up fluent-bit
Creating network "efk-docker_local" with driver "bridge"
Creating efk-docker_fluent-bit_1 ... done
Attaching to efk-docker_fluent-bit_1
fluent-bit_1     | Fluent Bit v1.8.11
fluent-bit_1     | * Copyright (C) 2019-2021 The Fluent Bit Authors
fluent-bit_1     | * Copyright (C) 2015-2018 Treasure Data
fluent-bit_1     | * Fluent Bit is a CNCF sub-project under the umbrella of Fluentd
fluent-bit_1     | * https://fluentbit.io
fluent-bit_1     |
fluent-bit_1     | [2022/01/11 09:36:39] [ info] [engine] started (pid=1)
fluent-bit_1     | [2022/01/11 09:36:39] [ info] [storage] version=1.1.5, initializing...
fluent-bit_1     | [2022/01/11 09:36:39] [ info] [storage] in-memory
fluent-bit_1     | [2022/01/11 09:36:39] [ info] [storage] normal synchronization mode, checksum disabled, max_chunks_up=128
fluent-bit_1     | [2022/01/11 09:36:39] [ info] [cmetrics] version=0.2.2
fluent-bit_1     | [2022/01/11 09:36:39] [ info] [input:forward:forward.0] listening on 0.0.0.0:24224
fluent-bit_1     | [2022/01/11 09:36:39] [ info] [http_server] listen iface=0.0.0.0 tcp_port=2020
fluent-bit_1     | [2022/01/11 09:36:39] [ info] [sp] stream processor started
^CGracefully stopping... (press Ctrl+C again to force)
Stopping efk-docker_fluent-bit_1 ... done
With regex parser, you can also take any unstructured
fluent-bit_1log entry and give them a structure that makes easier it processing and further filtering.conf/parsers.conf[PARSER] name json format json time_key time time_format %d/%b/%Y:%H:%M:%S %z [PARSER] name docker format json time_key time time_format %Y-%m-%dT%H:%M:%S.%L time_keep On [PARSER] name fluentbit format regex regex ^\[(?<time>[^\]]+)\] \[ (?<level>\w+)\] \[(?<compoment>\w+)\] (?<message>.*)$ time_key time time_format %Y/%m/%d %H:%M:%Sconf/fluent-bit.conf[SERVICE] flush 5 daemon off http_server on log_level info parsers_file parsers.conf [INPUT] Name forward Listen 0.0.0.0 Port 24224 [FILTER] name parser match efk.* key_name log parser json reserve_data true [FILTER] name parser match efk.fluent-bit key_name log parser fluentbit reserve_data true [OUTPUT] name es match * host ${FLB_ES_HOST} port ${FLB_ES_PORT} replace_dots on retry_limit false logstash_format on logstash_prefix fluent-bitThe following is a structured sample log output:
[ 1642068626.000000000, { "level"=>"info", "compoment"=>"storage", "message"=>"normal synchronization mode, checksum disabled, max_chunks_up=128", "container_id"=>"1a8f252975be8d83b534e76c81a2a47466314f52a5344b892d14c14f1d4be58b", "container_name"=>"/efk-docker_fluent-bit_1", "source"=>"stderr" } ] -
ElasticSearch Test
$ docker-compose up elasticsearch
Creating network "efk-docker_local" with driver "bridge"
Creating efk-docker_fluent-bit_1 ... done
Creating efk-docker_elasticsearch_1 ... done
Attaching to efk-docker_elasticsearch_1
elasticsearch_1  | {"type": "server", "timestamp": "2022-01-11T09:56:23,016Z", "level": "INFO", "component": "o.e.n.Node", "cluster.name": "docker-cluster", "node.name": "453b5fbbea27", "message": "version[7.10.2], pid[9], build[oss/docker/747e1cc71def077253878a59143c1f785afa92b9/2021-01-13T00:42:12.435326Z], OS[Linux/5.10.0-9-amd64/amd64], JVM[AdoptOpenJDK/OpenJDK 64-Bit Server VM/15.0.1/15.0.1+9]" }
elasticsearch_1  | {"type": "server", "timestamp": "2022-01-11T09:56:23,019Z", "level": "INFO", "component": "o.e.n.Node", "cluster.name": "docker-cluster", "node.name": "453b5fbbea27", "message": "JVM home [/usr/share/elasticsearch/jdk], using bundled JDK [true]" }
elasticsearch_1  | {"type": "server", "timestamp": "2022-01-11T09:56:23,020Z", "level": "INFO", "component": "o.e.n.Node", "cluster.name": "docker-cluster", "node.name": "453b5fbbea27", "message": "JVM arguments [-Xshare:auto, -Des.networkaddress.cache.ttl=60, -Des.networkaddress.cache.negative.ttl=10, -XX:+AlwaysPreTouch, -Xss1m, -Djava.awt.headless=true, -Dfile.encoding=UTF-8, -Djna.nosys=true, -XX:-OmitStackTraceInFastThrow, -XX:+ShowCodeDetailsInExceptionMessages, -Dio.netty.noUnsafe=true, -Dio.netty.noKeySetOptimization=true, -Dio.netty.recycler.maxCapacityPerThread=0, -Dio.netty.allocator.numDirectArenas=0, -Dlog4j.shutdownHookEnabled=false, -Dlog4j2.disable.jmx=true, -Djava.locale.providers=SPI,COMPAT, -Xms1g, -Xmx1g, -XX:+UseG1GC, -XX:G1ReservePercent=25, -XX:InitiatingHeapOccupancyPercent=30, -Djava.io.tmpdir=/tmp/elasticsearch-16115776092982339533, -XX:+HeapDumpOnOutOfMemoryError, -XX:HeapDumpPath=data, -XX:ErrorFile=logs/hs_err_pid%p.log, -Xlog:gc*,gc+age=trace,safepoint:file=logs/gc.log:utctime,pid,tags:filecount=32,filesize=64m, -Des.cgroups.hierarchy.override=/, -XX:MaxDirectMemorySize=536870912, -Des.path.home=/usr/share/elasticsearch, -Des.path.conf=/usr/share/elasticsearch/config, -Des.distribution.flavor=oss, -Des.distribution.type=docker, -Des.bundled_jdk=true]" }
...
elasticsearch_1  | {"type": "server", "timestamp": "2022-01-11T09:56:24,020Z", "level": "INFO", "component": "o.e.e.NodeEnvironment", "cluster.name": "docker-cluster", "node.name": "453b5fbbea27", "message": "using [1] data paths, mounts [[/usr/share/elasticsearch/data (/dev/sda1)]], net usable_space [47.2gb], net total_space [97.9gb], types [ext4]" }
...
elasticsearch_1  | {"type": "server", "timestamp": "2022-01-11T09:56:28,189Z", "level": "INFO", "component": "o.e.t.TransportService", "cluster.name": "docker-cluster", "node.name": "453b5fbbea27", "message": "publish_address {192.168.112.3:9300}, bound_addresses {0.0.0.0:9300}" }
...
elasticsearch_1  | {"type": "server", "timestamp": "2022-01-11T09:56:28,724Z", "level": "INFO", "component": "o.e.h.AbstractHttpServerTransport", "cluster.name": "docker-cluster", "node.name": "453b5fbbea27", "message": "publish_address {192.168.112.3:9200}, bound_addresses {0.0.0.0:9200}", "cluster.uuid": "Ylk56XOzTIehhBYYTVod2A", "node.id": "GJJwqaYqQWmv_wLXTquCqA"  }
...
^CGracefully stopping... (press Ctrl+C again to force)
Stopping efk-docker_elasticsearch_1 ... done
-
-
Startup all three services
$ docker-compose up Creating network "efk-docker_local" with driver "bridge" Creating efk-docker_fluent-bit_1 ... done Creating efk-docker_elasticsearch_1 ... done Creating efk-docker_kibana_1 ... done Attaching to efk-docker_fluent-bit_1, efk-docker_elasticsearch_1, efk-docker_kibana_1 ... -
Please go to
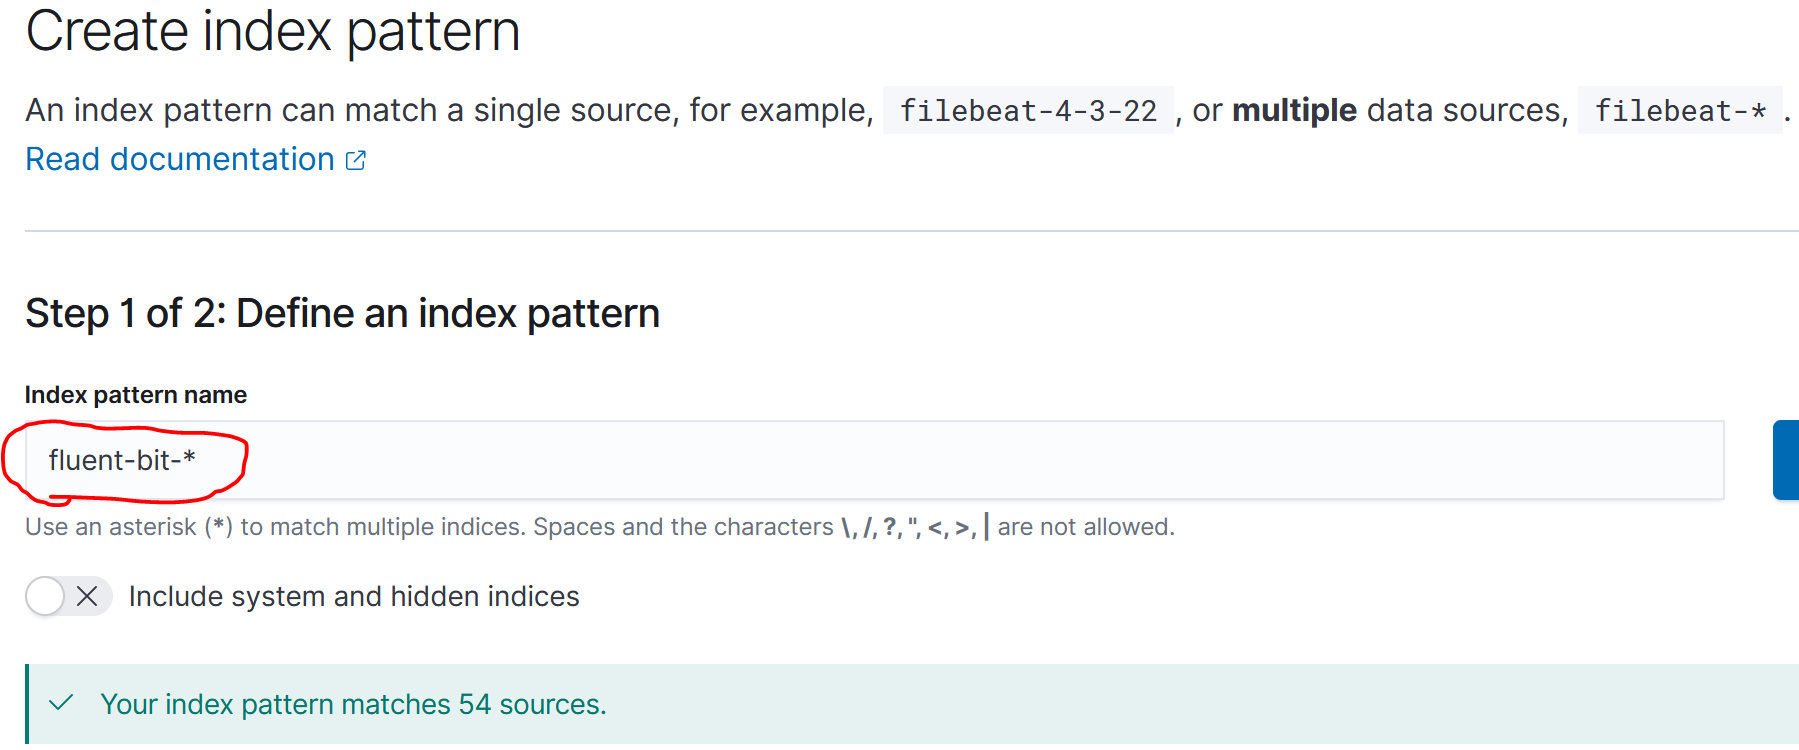
http://localhost:5601with your browser and follow the Kibana documentation to define your index pattern withfluent-bit-*,
-
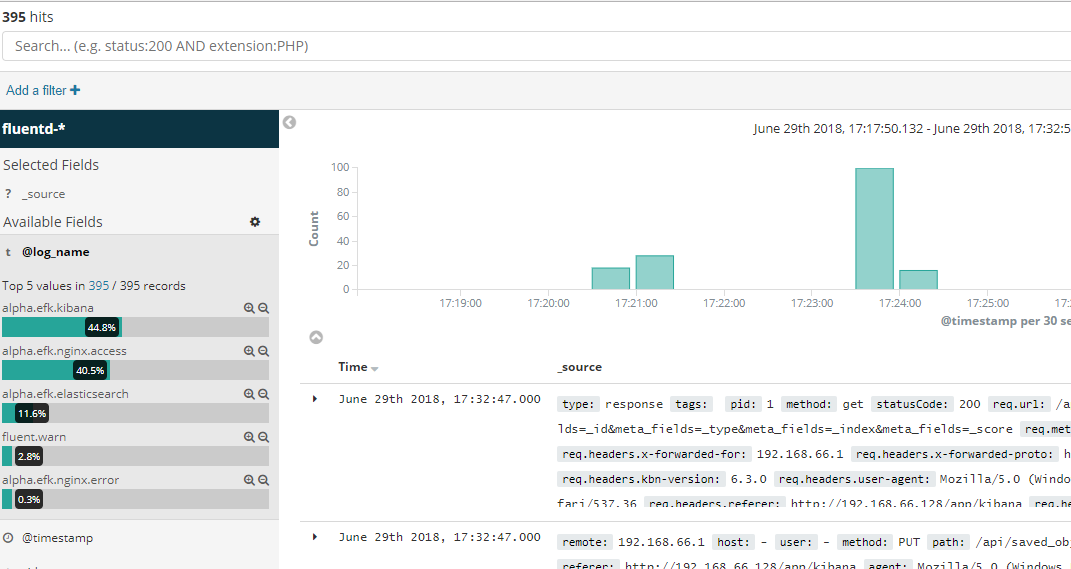
Fllow the Kibana documentation to explore your logging data for the Discover page.

