Designing Data-Intensive Applications: Stream Processing
In reality, a lot of data is unbounded because it arrives gradually over time: your users produced data yesterday and today, and they will continue to produce more data tomorrow. Unless you go out of business, this process never ends, and so the dataset is never “complete” in any meaningful way. Thus, batch processors must artificially divide the data into chunks of fixed duration: for example, processing a day’s worth of data at the end of every day, or processing an hour’s worth of data at the end of every hour.
The problem with daily batch processes is that changes in the input are only reflected in the output a day later, which is too slow for many impatient users. To reduce the delay, we can run the processing more frequently—say, processing a second’s worth of data at the end of every second—or even continuously, abandoning the fixed time slices entirely and simply processing every event as it happens. That is the idea behind stream processing.
- 1. Transmitting Event Streams
- 2. Databases and Streams
- 3. Processing Streams
- 4. What Is Apache Kafka?
- 5. References
1. Transmitting Event Streams
In the batch processing world, the inputs and outputs of a job are files (perhaps on a distributed filesystem). What does the streaming equivalent look like?
When the input is a file (a sequence of bytes), the first processing step is usually to parse it into a sequence of records. In a stream processing context, a record is more commonly known as an event, but it is essentially the same thing: a small, self-contained, immutable object containing the details of something that happened at some point in time. An event usually contains a timestamp indicating when it happened according to a time-of-day clock.
In batch processing, a file is written once and then potentially read by multiple jobs. Analogously, in streaming terminology, an event is generated once by a producer (also known as a publisher or sender), and then potentially processed by multiple consumers (subscribers or recipients). In a filesystem, a filename identifies a set of related records; in a streaming system, related events are usually grouped together into a topic or stream.
1.1. Messaging Systems
A common approach for notifying consumers about new events is to use a messaging system: a producer sends a message containing the event, which is then pushed to consumers.
Within this publish/subscribe model, different systems take a wide range of approaches, and there is no one right answer for all purposes. To differentiate the systems, it is particularly helpful to ask the following two questions:
-
What happens if the producers send messages faster than the consumers can process them?
Broadly speaking, there are three options: the system can drop messages, buffer messages in a queue, or apply backpressure.
If messages are buffered in a queue, it is important to understand what happens as that queue grows. Does the system crash if the queue no longer fits in memory, or does it write messages to disk? If so, how does the disk access affect the performance of the messaging system?
-
What happens if nodes crash or temporarily go offline—are any messages lost?
As with databases, durability may require some combination of writing to disk and/or replication, which has a cost. If you can afford to sometimes lose messages, you can probably get higher throughput and lower latency on the same hardware.
1.1.1. Direct messaging from producers to consumers
A number of messaging systems use direct network communication between producers and consumers without going via intermediary nodes:
-
UDP multicast is widely used in the financial industry for streams such as stock market feeds, where low latency is important. Although UDP itself is unreliable, application-level protocols can recover lost packets (the producer must remember packets it has sent so that it can retransmit them on demand).
-
Brokerless messaging libraries such as ZeroMQ and nanomsg take a similar approach, implementing publish/subscribe messaging over TCP or IP multicast.
1.1.2. Message brokers
A widely used alternative is to send messages via a message broker (also known as a message queue), which is essentially a kind of database that is optimized for handling message streams. It runs as a server, with producers and consumers connecting to it as clients. Producers write messages to the broker, and consumers receive them by reading them from the broker.
By centralizing the data in the broker, these systems can more easily tolerate clients that come and go (connect, disconnect, and crash), and the question of durability is moved to the broker instead. Some message brokers only keep messages in memory, while others (depending on configuration) write them to disk so that they are not lost in case of a broker crash. Faced with slow consumers, they generally allow unbounded queueing (as opposed to dropping messages or backpressure), although this choice may also depend on the configuration.
A consequence of queueing is also that consumers are generally asynchronous: when a producer sends a message, it normally only waits for the broker to confirm that it has buffered the message and does not wait for the message to be processed by consumers. The delivery to consumers will happen at some undetermined future point in time—often within a fraction of a second, but sometimes significantly later if there is a queue backlog.
1.1.3. Message brokers compared to databases
Some message brokers can even participate in two-phase commit protocols using XA or JTA. This feature makes them quite similar in nature to databases, although there are still important practical differences between message brokers and databases:
-
Databases usually keep data until it is explicitly deleted, whereas most message brokers automatically delete a message when it has been successfully delivered to its consumers. Such message brokers are not suitable for long-term data storage.
-
Since they quickly delete messages, most message brokers assume that their working set is fairly small—i.e., the queues are short. If the broker needs to buffer a lot of messages because the consumers are slow (perhaps spilling messages to disk if they no longer fit in memory), each individual message takes longer to process, and the overall throughput may degrade.
-
Databases often support secondary indexes and various ways of searching for data, while message brokers often support some way of subscribing to a subset of topics matching some pattern. The mechanisms are different, but both are essentially ways for a client to select the portion of the data that it wants to know about.
-
When querying a database, the result is typically based on a point-in-time snapshot of the data; if another client subsequently writes something to the database that changes the query result, the first client does not find out that its prior result is now outdated (unless it repeats the query, or polls for changes). By contrast, message brokers do not support arbitrary queries, but they do notify clients when data changes (i.e., when new messages become available).
This is the traditional view of message brokers, which is encapsulated in standards like JMS and AMQP and implemented in software like RabbitMQ, ActiveMQ, HornetQ, Qpid, TIBCO Enterprise Message Service, IBM MQ, Azure Service Bus, and Google Cloud Pub/Sub.
1.1.4. Multiple consumers
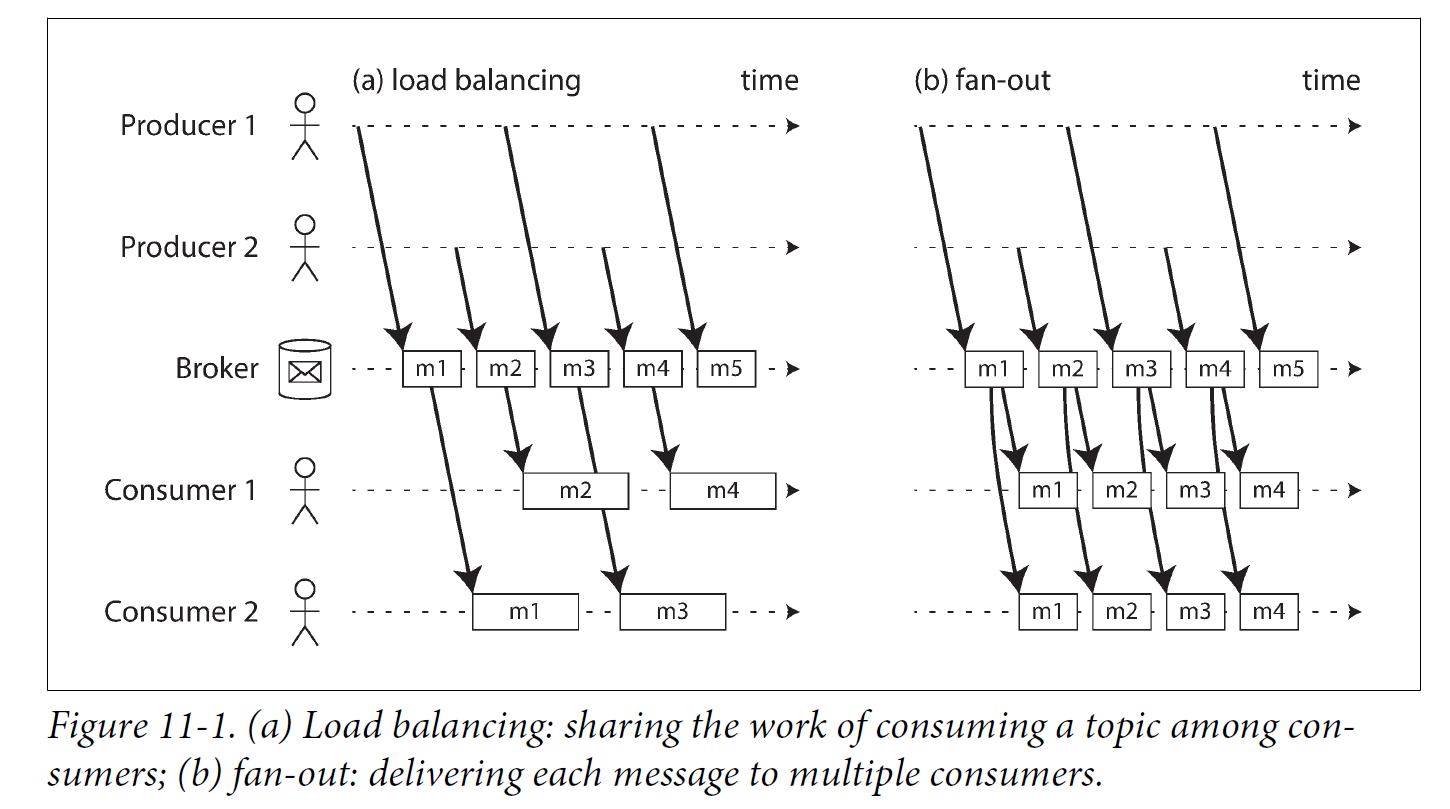
When multiple consumers read messages in the same topic, two main patterns of messaging are used, as illustrated in Figure 11-1:
-
Load balancing
Each message is delivered to one of the consumers, so the consumers can share the work of processing the messages in the topic. The broker may assign messages to consumers arbitrarily. This pattern is useful when the messages are expensive to process, and so you want to be able to add consumers to parallelize the processing.
-
Fan-out
Each message is delivered to all of the consumers. Fan-out allows several independent consumers to each “tune in” to the same broadcast of messages, without affecting each other—the streaming equivalent of having several different batch jobs that read the same input file.
The two patterns can be combined: for example, two separate groups of consumers may each subscribe to a topic, such that each group collectively receives all messages, but within each group only one of the nodes receives each message.
1.1.5. Acknowledgments and redelivery
Consumers may crash at any time, so it could happen that a broker delivers a message to a consumer but the consumer never processes it, or only partially processes it before crashing. In order to ensure that the message is not lost, message brokers use acknowledgments: a client must explicitly tell the broker when it has finished processing a message so that the broker can remove it from the queue.
If the connection to a client is closed or times out without the broker receiving an acknowledgment, it assumes that the message was not processed, and therefore it delivers the message again to another consumer. Note that it could happen that the message actually was fully processed, but the acknowledgment was lost in the network. Handling this case requires an atomic commit protocol.
When combined with load balancing, this redelivery behavior has an interesting effect on the ordering of messages.
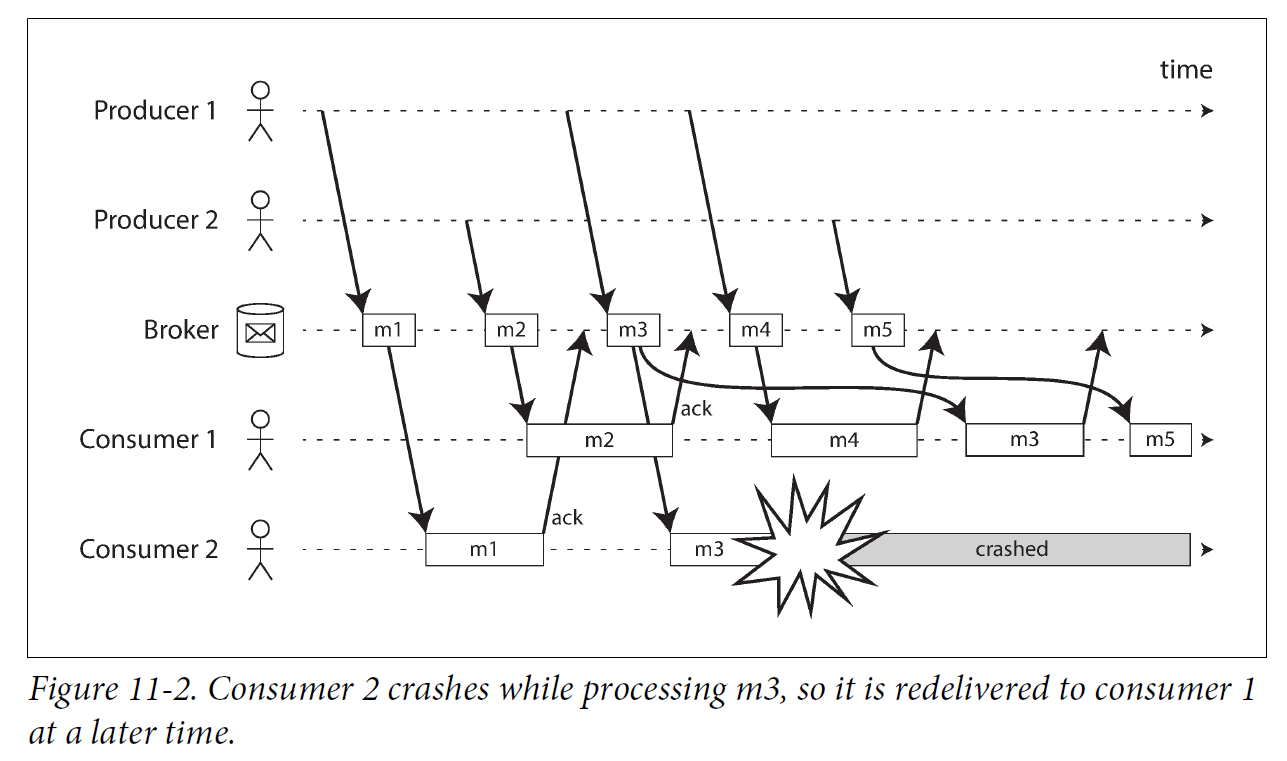
Even if the message broker otherwise tries to preserve the order of messages, the combination of load balancing with redelivery inevitably leads to messages being reordered. To avoid this issue, you can use a separate queue per consumer (i.e., not use the load balancing feature). Message reordering is not a problem if messages are completely independent of each other, but it can be important if there are causal dependencies between messages.
1.2. Partitioned Logs
Sending a packet over a network or making a request to a network service is normally a transient operation that leaves no permanent trace. Although it is possible to record it permanently (using packet capture and logging), we normally don’t think of it that way. Even message brokers that durably write messages to disk quickly delete them again after they have been delivered to consumers, because they are built around a transient messaging mindset.
Databases and filesystems take the opposite approach: everything that is written to a database or file is normally expected to be permanently recorded, at least until someone explicitly chooses to delete it again.
Why can we not have a hybrid, combining the durable storage approach of databases with the low-latency notification facilities of messaging? This is the idea behind logbased message brokers.
1.2.1. Using logs for message storage
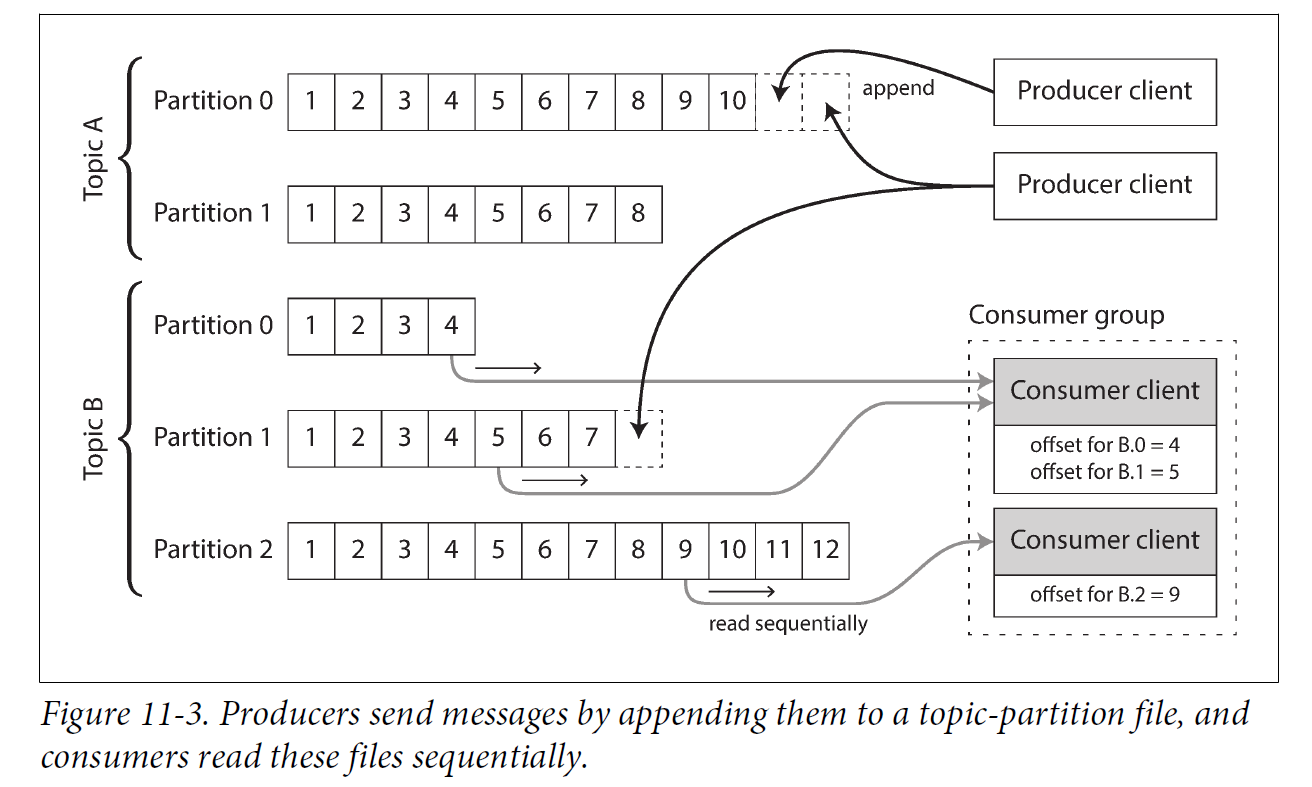
A log is simply an append-only sequence of records on disk, e.g. log-structured storage engines and write-ahead logs.
The same structure can be used to implement a message broker: a producer sends a message by appending it to the end of the log, and a consumer receives messages by reading the log sequentially. If a consumer reaches the end of the log, it waits for a notification that a new message has been appended. The Unix tool tail -f, which watches a file for data being appended, essentially works like this.
In order to scale to higher throughput than a single disk can offer, the log can be partitioned. Different partitions can then be hosted on different machines, making each partition a separate log that can be read and written independently from other partitions. A topic can then be defined as a group of partitions that all carry messages of the same type.
Within each partition, the broker assigns a monotonically increasing sequence number, or offset, to every message. Such a sequence number makes sense because a partition is append-only, so the messages within a partition are totally ordered. There is no ordering guarantee across different partitions.
Apache Kafka, Amazon Kinesis Streams, and Twitter’s DistributedLog are log-based message brokers that work like this. Google Cloud Pub/Sub is architecturally similar but exposes a JMS-style API rather than a log abstraction. Even though these message brokers write all messages to disk, they are able to achieve throughput of millions of messages per second by partitioning across multiple machines, and fault tolerance by replicating messages.
1.2.2. Logs compared to traditional messaging
The log-based approach trivially supports fan-out messaging, because several consumers can independently read the log without affecting each other—reading a message does not delete it from the log. To achieve load balancing across a group of consumers, instead of assigning individual messages to consumer clients, the broker can assign entire partitions to nodes in the consumer group.
Each client then consumes all the messages in the partitions it has been assigned. Typically, when a consumer has been assigned a log partition, it reads the messages in the partition sequentially, in a straightforward single-threaded manner. This coarse grained load balancing approach has some downsides:
-
The number of nodes sharing the work of consuming a topic can be at most the number of log partitions in that topic, because messages within the same partition are delivered to the same node.
-
If a single message is slow to process, it holds up the processing of subsequent messages in that partition (HOL, a form of head-of-line blocking).
Thus, in situations where messages may be expensive to process and you want to parallelize processing on a message-by-message basis, and where message ordering is not so important, the JMS/AMQP style of message broker is preferable. On the other hand, in situations with high message throughput, where each message is fast to process and where message ordering is important, the log-based approach works very well.
|
It’s possible to create a load balancing scheme in which two consumers share the work of processing a partition by having both read the full set of messages, but one of them only considers messages with even-numbered offsets while the other deals with the odd-numbered offsets. Alternatively, you could spread message processing over a thread pool, but that approach complicates consumer offset management. In general, single-threaded processing of a partition is preferable, and parallelism can be increased by using more partitions. |
1.2.3. Consumer offsets
Consuming a partition sequentially makes it easy to tell which messages have been processed: all messages with an offset less than a consumer’s current offset have already been processed, and all messages with a greater offset have not yet been seen.
Thus, the broker does not need to track acknowledgments for every single message—it only needs to periodically record the consumer offsets. The reduced bookkeeping overhead and the opportunities for batching and pipelining in this approach help increase the throughput of log-based systems.
This offset is in fact very similar to the log sequence number that is commonly found in single-leader database replication. In database replication, the log sequence number allows a follower to reconnect to a leader after it has become disconnected, and resume replication without skipping any writes. Exactly the same principle is used here: the message broker behaves like a leader database, and the consumer like a follower.
If a consumer node fails, another node in the consumer group is assigned the failed consumer’s partitions, and it starts consuming messages at the last recorded offset. If the consumer had processed subsequent messages but not yet recorded their offset, those messages will be processed a second time upon restart.
1.2.4. Disk space usage
If you only ever append to the log, you will eventually run out of disk space. To reclaim disk space, the log is actually divided into segments, and from time to time old segments are deleted or moved to archive storage.
This means that if a slow consumer cannot keep up with the rate of messages, and it falls so far behind that its consumer offset points to a deleted segment, it will miss some of the messages. Effectively, the log implements a bounded-size buffer that discards old messages when it gets full, also known as a circular buffer or ring buffer. However, since that buffer is on disk, it can be quite large.
Let’s do a back-of-the-envelope calculation. At the time of writing, a typical large hard drive has a capacity of 6 TB and a sequential write throughput of 150 MB/s. If you are writing messages at the fastest possible rate, it takes about 11 hours to fill the drive. Thus, the disk can buffer 11 hours’ worth of messages, after which it will start overwriting old messages. This ratio remains the same, even if you use many hard drives and machines. In practice, deployments rarely use the full write bandwidth of the disk, so the log can typically keep a buffer of several days’ or even weeks' worth of messages.
Regardless of how long you retain messages, the throughput of a log remains more or less constant, since every message is written to disk anyway. This behavior is in contrast to messaging systems that keep messages in memory by default and only write them to disk if the queue grows too large: such systems are fast when queues are short and become much slower when they start writing to disk, so the throughput depends on the amount of history retained.
1.2.5. When consumers cannot keep up with producers
If a consumer falls so far behind that the messages it requires are older than what is retained on disk, it will not be able to read those messages—so the broker effectively drops old messages that go back further than the size of the buffer can accommodate. You can monitor how far a consumer is behind the head of the log, and raise an alert if it falls behind significantly. As the buffer is large, there is enough time for a human operator to fix the slow consumer and allow it to catch up before it starts missing messages.
1.2.6. Replaying old messages
With AMQP- and JMS-style message brokers, processing and acknowledging messages is a destructive operation, since it causes the messages to be deleted on the broker. On the other hand, in a log-based message broker, consuming messages is more like reading from a file: it is a read-only operation that does not change the log.
This aspect makes log-based messaging more like the batch processes, where derived data is clearly separated from input data through a repeatable transformation process. It allows more experimentation and easier recovery from errors and bugs, making it a good tool for integrating dataflows within an organization.
1.3. AMQP/JMS-style message broker vs Log-based message broker
-
AMQP/JMS-style message broker
The broker assigns individual messages to consumers, and consumers acknowledge individual messages when they have been successfully processed. Messages are deleted from the broker once they have been acknowledged. This approach is appropriate as an asynchronous form of RPC, for example in a task queue, where the exact order of message processing is not important and where there is no need to go back and read old messages again after they have been processed.
-
Log-based message broker
The broker assigns all messages in a partition to the same consumer node, and always delivers messages in the same order. Parallelism is achieved through partitioning, and consumers track their progress by checkpointing the offset of the last message they have processed. The broker retains messages on disk, so it is possible to jump back and reread old messages if necessary.
2. Databases and Streams
We have drawn some comparisons between message brokers and databases. Even though they have traditionally been considered separate categories of tools, we saw that log-based message brokers have been successful in taking ideas from databases and applying them to messaging. We can also go in reverse: take ideas from messaging and streams, and apply them to databases.
In fact, a replication log is a stream of database write events, produced by the leader as it processes transactions. The followers apply that stream of writes to their own copy of the database and thus end up with an accurate copy of the same data. The events in the replication log describe the data changes that occurred.
The state machine replication principle with total order broadcast, which states: if every event represents a write to the database, and every replica processes the same events in the same order, then the replicas will all end up in the same final state. It’s just another case of event streams.
2.1. Keeping Systems in Sync
There is no single system that can satisfy all data storage, querying, and processing needs, and most nontrivial applications need to combine several different technologies in order to satisfy their requirements: for example, using an OLTP database to serve user requests, a cache to speed up common requests, a full-text index to handle search queries, and a data warehouse for analytics. Each of these has its own copy of the data, stored in its own representation that is optimized for its own purposes.
As the same or related data appears in several different places, they need to be kept in sync with one another: if an item is updated in the database, it also needs to be updated in the cache, search indexes, and data warehouse. With data warehouses this synchronization is usually performed by ETL processes, often by taking a full copy of a database, transforming it, and bulk-loading it into the data warehouse—in other words, a batch process. Similarly, search indexes, recommendation systems, and other derived data systems might be created using batch processes.
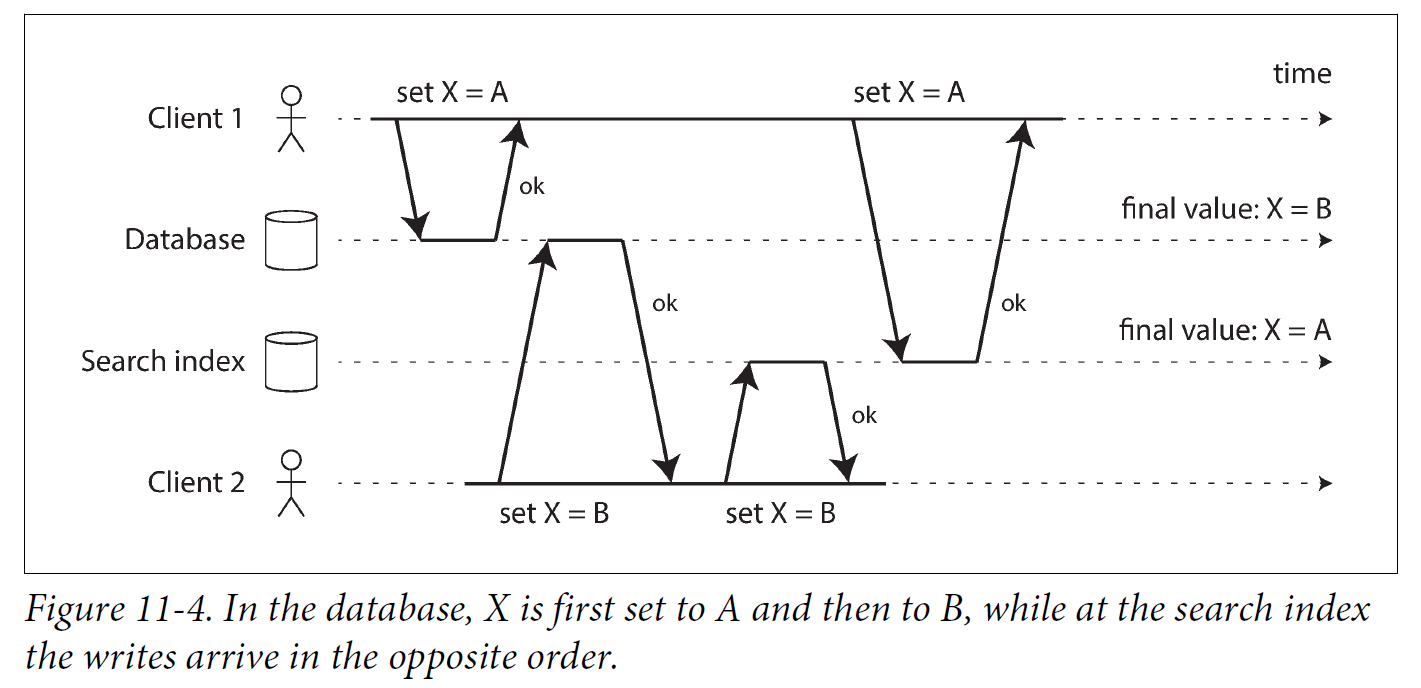
If periodic full database dumps are too slow, an alternative that is sometimes used is dual writes, in which the application code explicitly writes to each of the systems when data changes: for example, first writing to the database, then updating the search index, then invalidating the cache entries (or even performing those writes concurrently).
However, dual writes have some serious problems, one of which is a race condition.
Another problem with dual writes is that one of the writes may fail while the other succeeds. This is a fault-tolerance problem rather than a concurrency problem, but it also has the effect of the two systems becoming inconsistent with each other. Ensuring that they either both succeed or both fail is a case of the atomic commit problem, which is expensive to solve.
2.2. Change Data Capture
The problem with most databases’ replication logs is that they have long been considered to be an internal implementation detail of the database, not a public API. Clients are supposed to query the database through its data model and query language, not parse the replication logs and try to extract data from them.
For decades, many databases simply did not have a documented way of getting the log of changes written to them. For this reason it was difficult to take all the changes made in a database and replicate them to a different storage technology such as a search index, cache, or data warehouse.
More recently, there has been growing interest in change data capture (CDC), which is the process of observing all data changes written to a database and extracting them in a form in which they can be replicated to other systems. CDC is especially interesting if changes are made available as a stream, immediately as they are written.
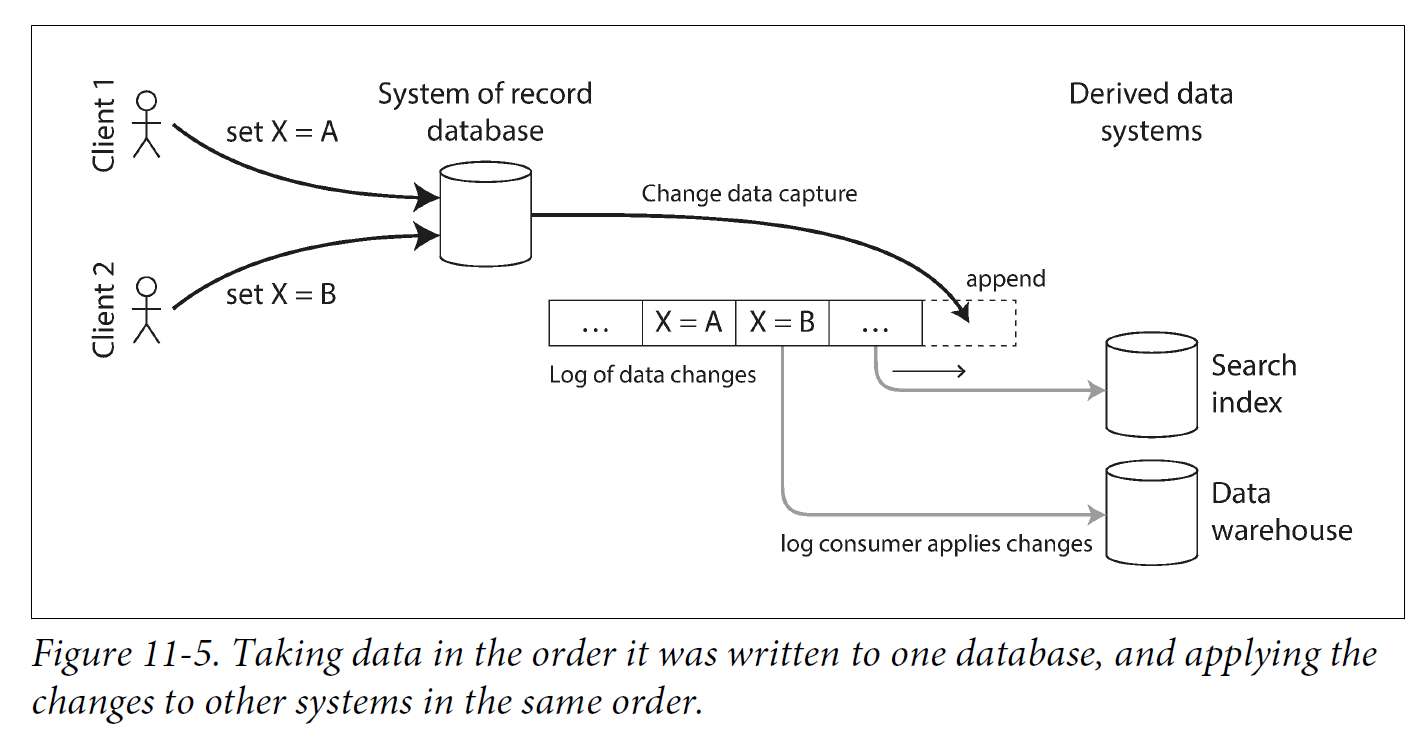
2.2.1. Implementing change data capture
We can call the log consumers derived data systems: the data stored in the search index and the data warehouse is just another view onto the data in the system of record. Change data capture is a mechanism for ensuring that all changes made to the system of record are also reflected in the derived data systems so that the derived systems have an accurate copy of the data.
Essentially, change data capture makes one database the leader (the one from which the changes are captured), and turns the others into followers. A log-based message broker is well suited for transporting the change events from the source database, since it preserves the ordering of messages.
Database triggers can be used to implement change data capture by registering triggers that observe all changes to data tables and add corresponding entries to a changelog table. However, they tend to be fragile and have significant performance overheads. Parsing the replication log can be a more robust approach, although it also comes with challenges, such as handling schema changes.
LinkedIn’s Databus, Facebook’s Wormhole, and Yahoo!’s Sherpa use this idea at large scale. Bottled Water implements CDC for PostgreSQL using an API that decodes the write-ahead log, Maxwell and Debezium do something similar for MySQL by parsing the binlog, Mongoriver reads the MongoDB oplog, and GoldenGate provides similar facilities for Oracle.
2.2.2. Log compaction
The principle of log compaction in the context of log-structured storage engines is simple: the storage engine periodically looks for log records with the same key, throws away any duplicates, and keeps only the most recent update for each key. This compaction and merging process runs in the background.
In a log-structured storage engine, an update with a special null value (a tombstone) indicates that a key was deleted, and causes it to be removed during log compaction. But as long as a key is not overwritten or deleted, it stays in the log forever. The disk space required for such a compacted log depends only on the current contents of the database, not the number of writes that have ever occurred in the database. If the same key is frequently overwritten, previous values will eventually be garbage collected, and only the latest value will be retained.
The same idea works in the context of log-based message brokers and change data capture. If the CDC system is set up such that every change has a primary key, and every update for a key replaces the previous value for that key, then it’s sufficient to keep just the most recent write for a particular key.
This feature is supported by Apache Kafka. It allows the message broker to be used for durable storage, not just for transient messaging.
2.2.3. API support for change streams
Increasingly, databases are beginning to support change streams as a first-class interface, rather than the typical retrofitted and reverse-engineered CDC efforts. For example, RethinkDB allows queries to subscribe to notifications when the results of a query change, Firebase and CouchDB provide data synchronization based on a change feed that is also made available to applications, and Meteor uses the MongoDB oplog to subscribe to data changes and update the user interface.
Kafka Connect is an effort to integrate change data capture tools for a wide range of database systems with Kafka. Once the stream of change events is in Kafka, it can be used to update derived data systems such as search indexes, and also feed into stream processing systems.
2.3. Event Sourcing
Similarly to change data capture, event sourcing involves storing all changes to the application state as a log of change events. The biggest difference is that event sourcing applies the idea at a different level of abstraction:
-
In change data capture, the application uses the database in a mutable way, updating and deleting records at will. The log of changes is extracted from the database at a low level (e.g., by parsing the replication log), which ensures that the order of writes extracted from the database matches the order in which they were actually written, avoiding the race condition. The application writing to the database does not need to be aware that CDC is occurring.
-
In event sourcing, the application logic is explicitly built on the basis of immutable events that are written to an event log. In this case, the event store is appendonly, and updates or deletes are discouraged or prohibited. Events are designed to reflect things that happened at the application level, rather than low-level state changes.
Event sourcing is a powerful technique for data modeling: from an application point of view it is more meaningful to record the user’s actions as immutable events, rather than recording the effect of those actions on a mutable database. Event sourcing makes it easier to evolve applications over time, helps with debugging by making it easier to understand after the fact why something happened, and guards against application bugs.
2.3.1. Deriving current state from the event log
An event log by itself is not very useful, because users generally expect to see the current state of a system, not the history of modifications. For example, on a shopping website, users expect to be able to see the current contents of their cart, not an append-only list of all the changes they have ever made to their cart.
Thus, applications that use event sourcing need to take the log of events (representing the data written to the system) and transform it into application state that is suitable for showing to a user (the way in which data is read from the system). This transformation can use arbitrary logic, but it should be deterministic so that you can run it again and derive the same application state from the event log.
Applications that use event sourcing typically have some mechanism for storing snapshots of the current state that is derived from the log of events, so they don’t need to repeatedly reprocess the full log. However, this is only a performance optimization to speed up reads and recovery from crashes; the intention is that the system is able to store all raw events forever and reprocess the full event log whenever required.
2.3.2. Commands and events
The event sourcing philosophy is careful to distinguish between events and commands. When a request from a user first arrives, it is initially a command: at this point it may still fail, for example because some integrity condition is violated. The application must first validate that it can execute the command. If the validation is successful and the command is accepted, it becomes an event, which is durable and immutable.
For example, if a user tries to register a particular username, or reserve a seat on an airplane or in a theater, then the application needs to check that the username or seat is not already taken. When that check has succeeded, the application can generate an event to indicate that a particular username was registered by a particular user ID, or that a particular seat has been reserved for a particular customer.
At the point when the event is generated, it becomes a fact. Even if the customer later decides to change or cancel the reservation, the fact remains true that they formerly held a reservation for a particular seat, and the change or cancellation is a separate event that is added later.
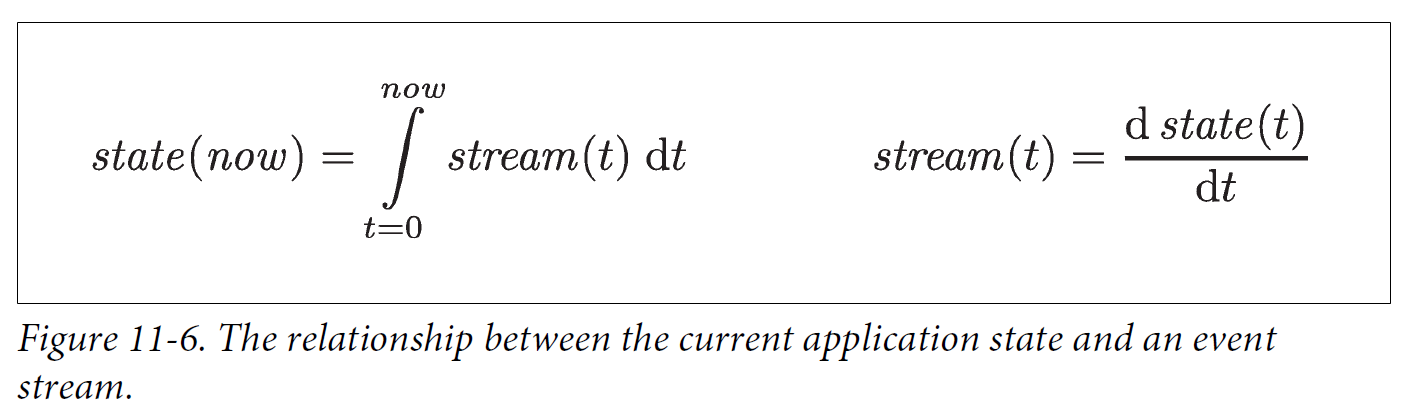
2.4. State, Streams, and Immutability
We normally think of databases as storing the current state of the application—this representation is optimized for reads, and it is usually the most convenient for serving queries. The nature of state is that it changes, so databases support updating and deleting data as well as inserting it. How does this fit with immutability?
No matter how the state changes, there was always a sequence of events that caused those changes. Even as things are done and undone, the fact remains true that those events occurred. The key idea is that mutable state and an append-only log of immutable events do not contradict each other: they are two sides of the same coin. The log of all changes, the changelog, represents the evolution of state over time.
If you store the changelog durably, that simply has the effect of making the state reproducible. If you consider the log of events to be your system of record, and any mutable state as being derived from it, it becomes easier to reason about the flow of data through a system. As Pat Helland puts it:
Transaction logs record all the changes made to the database. High-speed appends are the only way to change the log. From this perspective, the contents of the database hold a caching of the latest record values in the logs. The truth is the log. The database is a cache of a subset of the log. That cached subset happens to be the latest value of each record and index value from the log.
2.4.1. Advantages of immutable events
Immutability in databases is an old idea. For example, accountants have been using immutability for centuries in financial bookkeeping. When a transaction occurs, it is recorded in an append-only ledger, which is essentially a log of events describing money, goods, or services that have changed hands. The accounts, such as profit and loss or the balance sheet, are derived from the transactions in the ledger by adding them up.
If a mistake is made, accountants don’t erase or change the incorrect transaction in the ledger—instead, they add another transaction that compensates for the mistake, for example refunding an incorrect charge. The incorrect transaction still remains in the ledger forever, because it might be important for auditing reasons. If incorrect figures, derived from the incorrect ledger, have already been published, then the figures for the next accounting period include a correction. This process is entirely normal in accounting.
Although such auditability is particularly important in financial systems, it is also beneficial for many other systems that are not subject to such strict regulation. If you accidentally deploy buggy code that writes bad data to a database, recovery is much harder if the code is able to destructively overwrite data. With an append-only log of immutable events, it is much easier to diagnose what happened and recover from the problem.
Immutable events also capture more information than just the current state. For example, on a shopping website, a customer may add an item to their cart and then remove it again. Although the second event cancels out the first event from the point of view of order fulfillment, it may be useful to know for analytics purposes that the customer was considering a particular item but then decided against it. Perhaps they will choose to buy it in the future, or perhaps they found a substitute. This information is recorded in an event log, but would be lost in a database that deletes items when they are removed from the cart.
2.4.2. Deriving several views from the same event log
Moreover, by separating mutable state from the immutable event log, you can derive several different read-oriented representations from the same log of events.
Storing data is normally quite straightforward if you don’t have to worry about how it is going to be queried and accessed; many of the complexities of schema design, indexing, and storage engines are the result of wanting to support certain query and access patterns. For this reason, you gain a lot of flexibility by separating the form in which data is written from the form it is read, and by allowing several different read views. This idea is sometimes known as command query responsibility segregation (CQRS).
2.4.3. Concurrency control
The biggest downside of event sourcing and change data capture is that the consumers of the event log are usually asynchronous, so there is a possibility that a user may make a write to the log, then read from a log-derived view and find that their write has not yet been reflected in the read view.
One solution would be to perform the updates of the read view synchronously with appending the event to the log. This requires a transaction to combine the writes into an atomic unit, so either you need to keep the event log and the read view in the same storage system, or you need a distributed transaction across the different systems.
2.4.4. Limitations of immutability
Many systems that don’t use an event-sourced model nevertheless rely on immutability: various databases internally use immutable data structures or multi-version data to support point-in-time snapshots. Version control systems such as Git, Mercurial, and Fossil also rely on immutable data to preserve version history of files.
To what extent is it feasible to keep an immutable history of all changes forever? The answer depends on the amount of churn in the dataset. Some workloads mostly add data and rarely update or delete; they are easy to make immutable. Other workloads have a high rate of updates and deletes on a comparatively small dataset; in these cases, the immutable history may grow prohibitively large, fragmentation may become an issue, and the performance of compaction and garbage collection becomes crucial for operational robustness.
Besides the performance reasons, there may also be circumstances in which you need data to be deleted for administrative reasons, in spite of all immutability. For example, privacy regulations may require deleting a user’s personal information after they close their account, data protection legislation may require erroneous information to be removed, or an accidental leak of sensitive information may need to be contained.
Truly deleting data is surprisingly hard, since copies can live in many places: for example, storage engines, filesystems, and SSDs often write to a new location rather than overwriting in place, and backups are often deliberately immutable to prevent accidental deletion or corruption. Deletion is more a matter of “making it harder to retrieve the data” than actually “making it impossible to retrieve the data.”
3. Processing Streams
-
You can take the data in the events and write it to a database, cache, search index, or similar storage system, from where it can then be queried by other clients.
-
You can push the events to users in some way, for example by sending email alerts or push notifications, or by streaming the events to a real-time dashboard where they are visualized. In this case, a human is the ultimate consumer of the stream.
-
You can process one or more input streams to produce one or more output streams. Streams may go through a pipeline consisting of several such processing stages before they eventually end up at an output (option 1 or 2).
A piece of code that processes streams like this is known as an operator or a job. It is closely related to the Unix processes and MapReduce jobs, and the pattern of dataflow is similar: a stream processor consumes input streams in a read-only fashion and writes its output to a different location in an append-only fashion.
3.1. Uses of Stream Processing
Stream processing has long been used for monitoring purposes, where an organization wants to be alerted if certain things happen.
3.1.1. Complex event processing
Complex event processing (CEP) is an approach developed in the 1990s for analyzing event streams, especially geared toward the kind of application that requires searching for certain event patterns. Similarly to the way that a regular expression allows you to search for certain patterns of characters in a string, CEP allows you to specify rules to search for certain patterns of events in a stream.
CEP systems often use a high-level declarative query language like SQL, or a graphical user interface, to describe the patterns of events that should be detected. These queries are submitted to a processing engine that consumes the input streams and internally maintains a state machine that performs the required matching. When a match is found, the engine emits a complex event (hence the name) with the details of the event pattern that was detected.
In these systems, the relationship between queries and data is reversed compared to normal databases. Usually, a database stores data persistently and treats queries as transient: when a query comes in, the database searches for data matching the query, and then forgets about the query when it has finished. CEP engines reverse these roles: queries are stored long-term, and events from the input streams continuously flow past them in search of a query that matches an event pattern.
3.1.2. Stream analytics
The boundary between CEP and stream analytics is blurry, but as a general rule, analytics tends to be less interested in finding specific event sequences and is more oriented toward aggregations and statistical metrics over a large number of events—for example:
-
Measuring the rate of some type of event (how often it occurs per time interval)
-
Calculating the rolling average of a value over some time period
-
Comparing current statistics to previous time intervals (e.g., to detect trends or to alert on metrics that are unusually high or low compared to the same time last week)
Such statistics are usually computed over fixed time intervals—for example, you might want to know the average number of queries per second to a service over the last 5 minutes, and their 99th percentile response time during that period. Averaging over a few minutes smoothes out irrelevant fluctuations from one second to the next, while still giving you a timely picture of any changes in traffic pattern. The time interval over which you aggregate is known as a window.
Stream analytics systems sometimes use probabilistic algorithms, such as Bloom filters for set membership, HyperLogLog for cardinality estimation, and various percentile estimation algorithms. Probabilistic algorithms produce approximate results, but have the advantage of requiring significantly less memory in the stream processor than exact algorithms. This use of approximation algorithms sometimes leads people to believe that stream processing systems are always lossy and inexact, but that is wrong: there is nothing inherently approximate about stream processing, and probabilistic algorithms are merely an optimization.
Many open source distributed stream processing frameworks are designed with analytics in mind: for example, Apache Storm, Spark Streaming, Flink, Concord, Samza, and Kafka Streams. Hosted services include Google Cloud Dataflow and Azure Stream Analytics.
3.1.3. Reasoning About Time
Stream processors often need to deal with time, especially when used for analytics purposes, which frequently use time windows such as “the average over the last five minutes.” It might seem that the meaning of “the last five minutes” should be unambiguous and clear, but unfortunately the notion is surprisingly tricky.
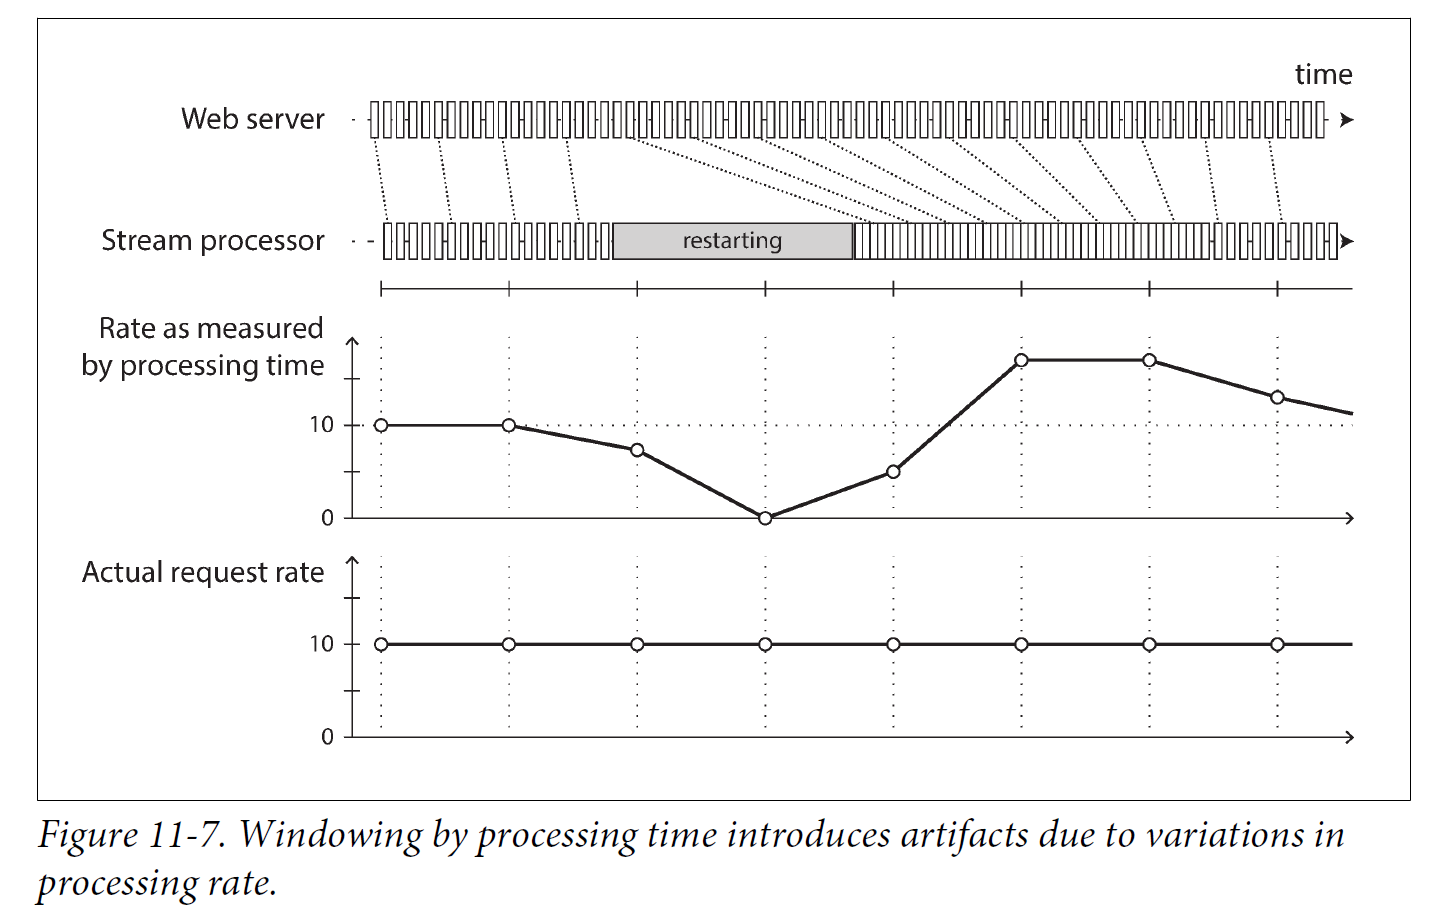
Event time versus processing time
There are many reasons why processing may be delayed: queueing, network faults, a performance issue leading to contention in the message broker or processor, a restart of the stream consumer, or reprocessing of past events while recovering from a fault or after fixing a bug in the code.
Moreover, message delays can also lead to unpredictable ordering of messages. For example, say a user first makes one web request (which is handled by web server A), and then a second request (which is handled by server B). A and B emit events describing the requests they handled, but B’s event reaches the message broker before A’s event does. Now stream processors will first see the B event and then the A event, even though they actually occurred in the opposite order.
3.1.4. Types of windows
Once you know how the timestamp of an event should be determined, the next step is to decide how windows over time periods should be defined. The window can then be used for aggregations, for example to count events, or to calculate the average of values within the window. Several types of windows are in common use:
-
Tumbling window
A tumbling window has a fixed length, and every event belongs to exactly one window. For example, if you have a 1-minute tumbling window, all the events with timestamps between 10:03:00 and 10:03:59 are grouped into one window, events between 10:04:00 and 10:04:59 into the next window, and so on. You could implement a 1-minute tumbling window by taking each event timestamp and rounding it down to the nearest minute to determine the window that it belongs to.
-
Hopping window
A hopping window also has a fixed length, but allows windows to overlap in order to provide some smoothing. For example, a 5-minute window with a hop size of 1 minute would contain the events between 10:03:00 and 10:07:59, then the next window would cover events between 10:04:00 and 10:08:59, and so on. You can implement this hopping window by first calculating 1-minute tumbling windows, and then aggregating over several adjacent windows.
-
Sliding window
A sliding window contains all the events that occur within some interval of each other. For example, a 5-minute sliding window would cover events at 10:03:39 and 10:08:12, because they are less than 5 minutes apart (note that tumbling and hopping 5-minute windows would not have put these two events in the same window, as they use fixed boundaries). A sliding window can be implemented by keeping a buffer of events sorted by time and removing old events when they expire from the window.
-
Session window
Unlike the other window types, a session window has no fixed duration. Instead, it is defined by grouping together all events for the same user that occur closely together in time, and the window ends when the user has been inactive for some time (for example, if there have been no events for 30 minutes). Sessionization is a common requirement for website analytics.
3.2. Stream Joins
-
Stream-stream join (window join)
Both input streams consist of activity events, and the join operator searches for related events that occur within some window of time. For example, it may match two actions taken by the same user within 30 minutes of each other. The two join inputs may in fact be the same stream (a self-join) if you want to find related events within that one stream.
-
Stream-table join (stream enrichment)
One input stream consists of activity events, while the other is a database changelog. The changelog keeps a local copy of the database up to date. For each activity event, the join operator queries the database and outputs an enriched activity event.
-
Table-table join (materialized view maintenance)
Both input streams are database changelogs. In this case, every change on one side is joined with the latest state of the other side. The result is a stream of changes to the materialized view of the join between the two tables.
3.3. Fault Tolerance
3.3.1. Microbatching and checkpointing
One solution is to break the stream into small blocks, and treat each block like a miniature batch process. This approach is called microbatching, and it is used in Spark Streaming. The batch size is typically around one second, which is the result of a performance compromise: smaller batches incur greater scheduling and coordination overhead, while larger batches mean a longer delay before results of the stream processor become visible.
Microbatching also implicitly provides a tumbling window equal to the batch size (windowed by processing time, not event timestamps); any jobs that require larger windows need to explicitly carry over state from one microbatch to the next.
A variant approach, used in Apache Flink, is to periodically generate rolling checkpoints of state and write them to durable storage. If a stream operator crashes, it can restart from its most recent checkpoint and discard any output generated between the last checkpoint and the crash. The checkpoints are triggered by barriers in the message stream, similar to the boundaries between microbatches, but without forcing a particular window size.
Within the confines of the stream processing framework, the microbatching and checkpointing approaches provide the same exactly-once semantics as batch processing. However, as soon as output leaves the stream processor (for example, by writing to a database, sending messages to an external message broker, or sending emails), the framework is no longer able to discard the output of a failed batch. In this case, restarting a failed task causes the external side effect to happen twice, and microbatching or checkpointing alone is not sufficient to prevent this problem.
3.3.2. Atomic commit revisited
In order to give the appearance of exactly-once processing in the presence of faults, we need to ensure that all outputs and side effects of processing an event take effect if and only if the processing is successful. Those effects include any messages sent to downstream operators or external messaging systems (including email or push notifications), any database writes, any changes to operator state, and any acknowledgment of input messages (including moving the consumer offset forward in a log-based message broker).
Those things either all need to happen atomically, or none of them must happen, but they should not go out of sync with each other.
-
Distributed transactions vs Log-based derived data systems
At an abstract level, they achieve a similar goal by different means.
Distributed transactions decide on an ordering of writes by using locks for mutual exclusion (2PL), while CDC and event sourcing use a log for ordering.
Distributed transactions use atomic commit to ensure that changes take effect exactly once, while log-based systems are often based on deterministic retry and idempotence.
The biggest difference is that transaction systems usually provide linearizability, which implies useful guarantees such as reading your own writes.
On the other hand, derived data systems are often updated asynchronously, and so they do not by default offer the same timing guarantees.
3.3.3. Idempotence
Our goal is to discard the partial output of any failed tasks so that they can be safely retried without taking effect twice. Distributed transactions are one way of achieving that goal, but another way is to rely on idempotence.
3.3.4. Rebuilding state after a failure
Any stream process that requires state—for example, any windowed aggregations (such as counters, averages, and histograms) and any tables and indexes used for joins—must ensure that this state can be recovered after a failure.
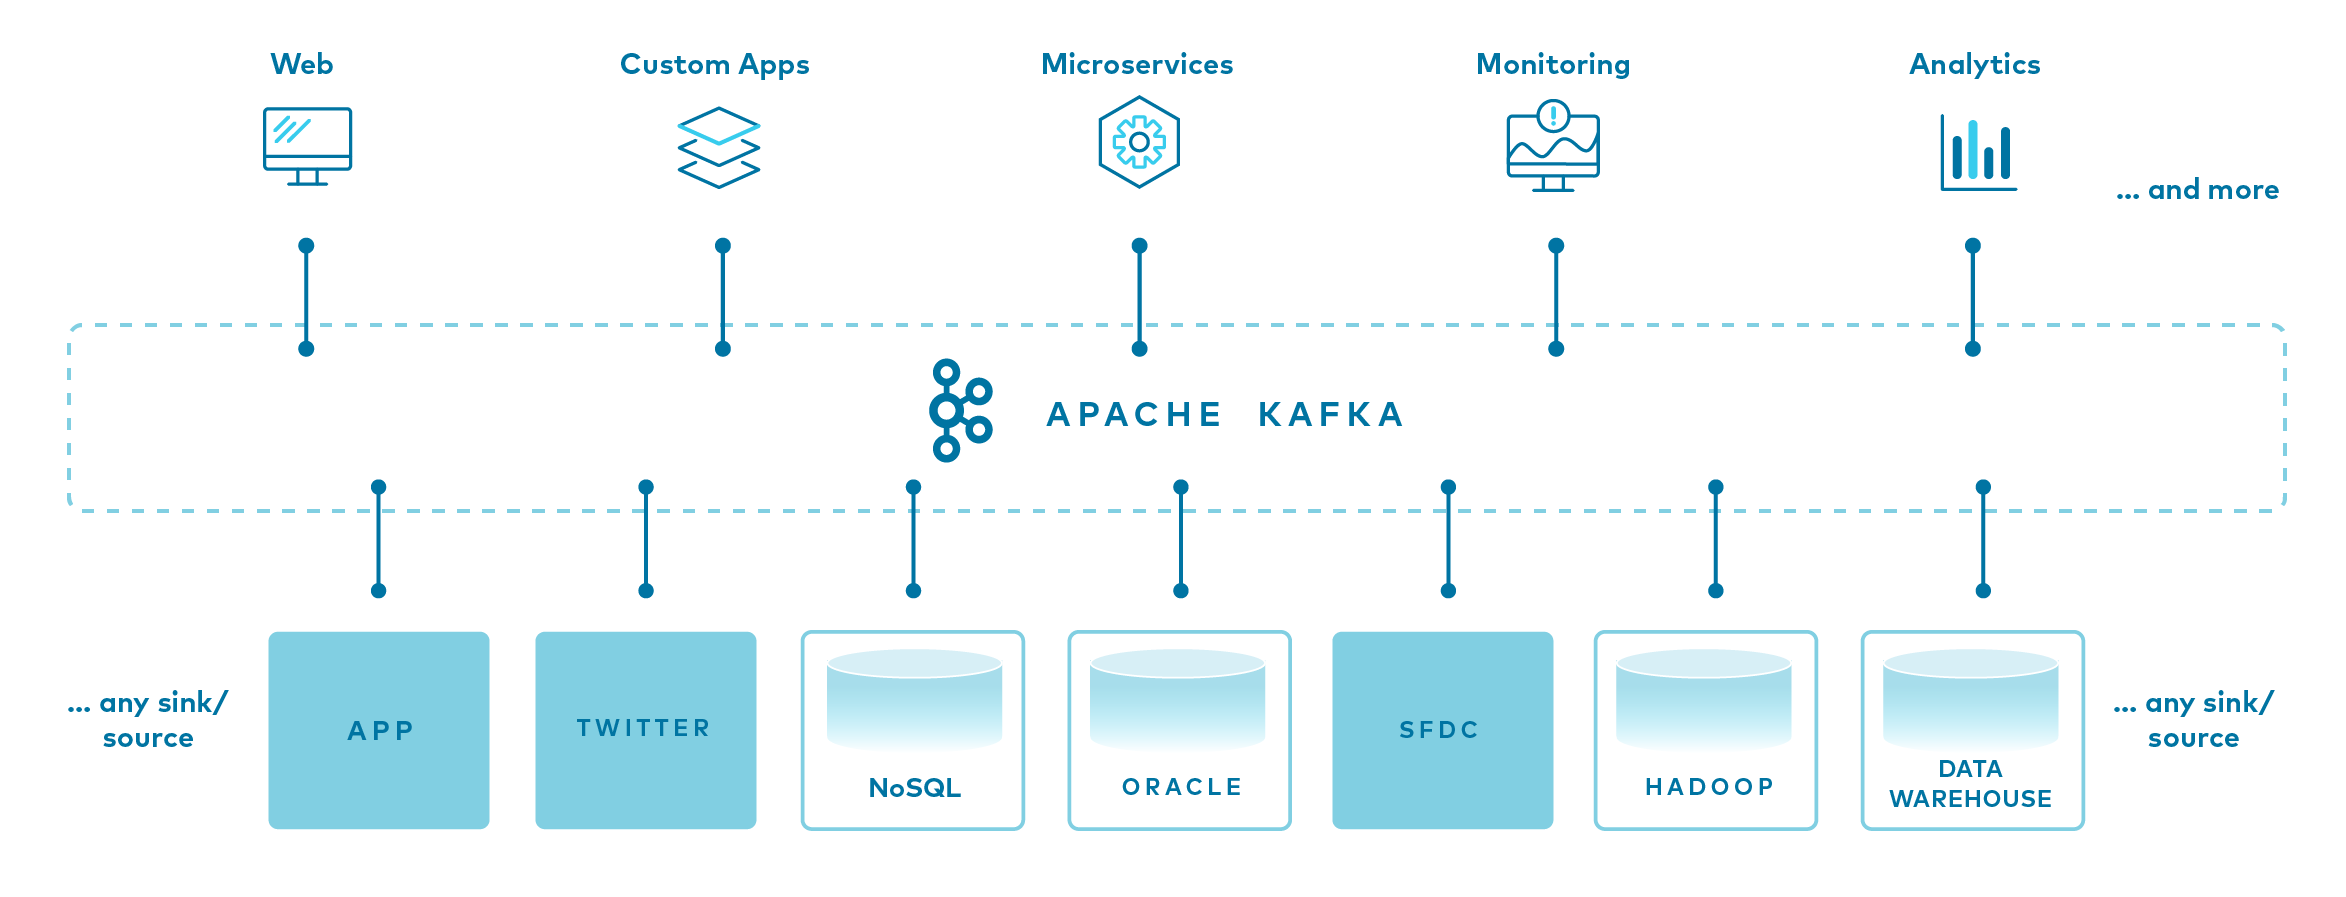
4. What Is Apache Kafka?
Apache Kafka is an event streaming platform used to collect, process, store, and integrate data at scale. It has numerous use cases including distributed streaming, stream processing, data integration, and pub/sub messaging.
An event records the fact that "something happened" in the world or in your business. It is also called record or message. For example, a payment, a website click, or a temperature reading, along with a description of what happened. Conceptually, an event has a key, value, timestamp, and optional metadata headers.
key: "Alice"
value: "Made a payment of $200 to Bob"
timestamp: "Jun. 25, 2020 at 2:06 p.m."
Event is usually fairly small, say less than a megabyte or so, and is normally represented in some structured format, say in JSON or an object serialized with Apache Avro™ or Protocol Buffers.
Kafka is based on the abstraction of a distributed commit log. By splitting a log into partitions, Kafka is able to scale-out systems.
Producers are those client applications that publish (write) events to Kafka, and consumers are those that subscribe to (read and process) these events.
A topic is a log of events. Logs are easy to understand, because they are simple data structures with well-known semantics.
-
First, they are append only: When you write a new message into a log, it always goes on the end.
-
Second, they can only be read by seeking an arbitrary offset in the log, then by scanning sequential log entries.
-
Third, events in the log are immutable—once something has happened, it is exceedingly difficult to make it un-happen.
Kafka is composed of a network of machines called brokers. Each broker hosts some set of partitions and handles incoming requests to write new events to those partitions or read events from them.
Topics are partitioned, meaning a topic is spread over a number of "buckets" located on different Kafka brokers.
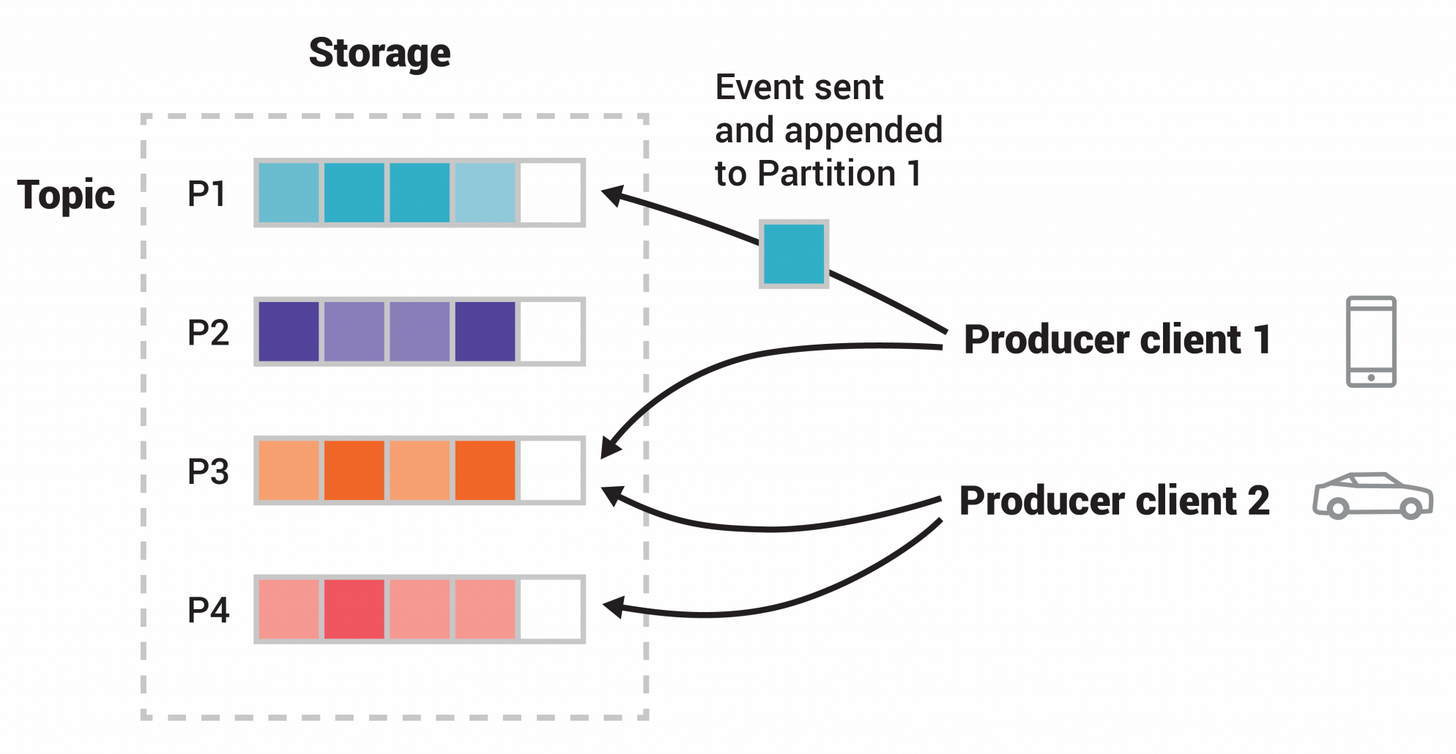
Having broken a topic up into partitions, we need a way of deciding which messages to write to which partitions.
-
If a message has no key, subsequent messages will be distributed round-robin among all the topic’s partitions.
In this case, all partitions get an even share of the data, but we don’t preserve any kind of ordering of the input messages.
-
If the message does have a key, then the destination partition will be computed from a hash of the key.
This allows Kafka to guarantee that messages having the same key always land in the same partition, and therefore are always in order.
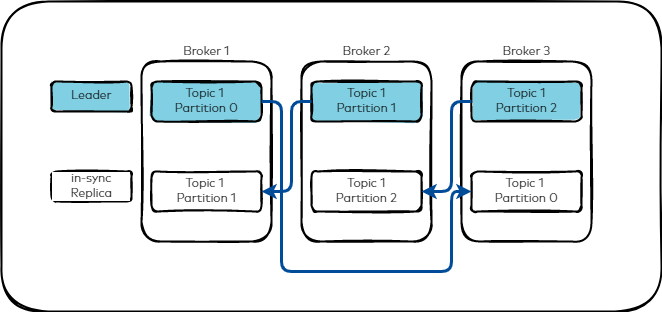
To make your data fault-tolerant and highly-available, the partitions of every topic can be replicated. A common production setting is a replication factor of 3, i.e., there will always be three copies of your data.
4.1. The Producer
-
The producer sends data directly to the broker that is the leader for the partition without any intervening routing tier.
To help the producer do this all Kafka nodes can answer a request for metadata about which servers are alive and where the leaders for the partitions of a topic are at any given time to allow the producer to appropriately direct its requests.
-
The client controls which partition it publishes messages to. This can be done at random, implementing a kind of random load balancing, or it can be done by some semantic partitioning function.
We expose the interface for semantic partitioning by allowing the user to specify a key to partition by and using this to hash to a partition.
-
Batching is one of the big drivers of efficiency, and to enable batching the Kafka producer will attempt to accumulate data in memory and to send out larger batches in a single request asynchronously.
4.2. The Consumer
Messaging traditionally has two models: queuing and publish-subscribe.
-
In a queue, a pool of consumers may read from a server and each message goes to one of them;
-
In publish-subscribe the message is broadcast to all consumers.
Kafka offers a single consumer abstraction that generalizes both of these—the consumer group.
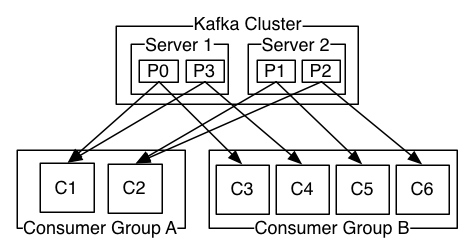
Consumers label themselves with a consumer group name, and each message published to a topic is delivered to one consumer instance within each subscribing consumer group. Consumer instances can be in separate processes or on separate machines.
If all the consumer instances have the same consumer group, then this works just like a traditional queue balancing load over the consumers.
If all the consumer instances have different consumer groups, then this works like publish-subscribe and all messages are broadcast to all consumers.
Kafka has stronger ordering guarantees than a traditional messaging system, too.
A traditional queue retains messages in-order on the server, and if multiple consumers consume from the queue then the server hands out messages in the order they are stored.
-
However, although the server hands out messages in order, the messages are delivered asynchronously to consumers, so they may arrive out of order on different consumers.
-
This effectively means the ordering of the messages is lost in the presence of parallel consumption.
-
Messaging systems often work around this by having a notion of "exclusive consumer" that allows only one process to consume from a queue, but of course this means that there is no parallelism in processing.
Kafka does it better. By having a notion of parallelism—the partition—within the topics, Kafka is able to provide both ordering guarantees and load balancing over a pool of consumer processes.
-
This is achieved by assigning the partitions in the topic to the consumers in the consumer group so that each partition is consumed by exactly one consumer in the group.
-
By doing this we ensure that the consumer is the only reader of that partition and consumes the data in order.
-
Since there are many partitions this still balances the load over many consumer instances.
-
Note however that there cannot be more consumer instances than partitions.
Kafka only provides a total order over messages within a partition.
-
This combined with the ability to partition data by key is sufficient for the vast majority of applications.
-
However, if you require a total order over messages this can be achieved with a topic that has only one partition, though this will mean only one consumer process.
Push vs. pull
-
The Kafka consumer works by issuing "fetch" requests to the brokers leading the partitions it wants to consume.
The consumer specifies its offset in the log with each request and receives back a chunk of log beginning from that position.
The consumer thus has significant control over this position and can rewind it to re-consume data if need be.
4.3. Message Delivery Semantics
In a distributed publish-subscribe messaging system, the computers that make up the system can always fail independently of one another. In the case of Kafka, an individual broker can crash, or a network failure can happen while the producer is sending a message to a topic. Depending on the action the producer takes to handle such a failure, you can get different semantics:
-
At-least-once semantics:
If the producer receives an acknowledgement (ack) from the Kafka broker and acks=all, it means that the message has been written exactly once to the Kafka topic.
However, if a producer ack times out or receives an error, it might retry sending the message assuming that the message was not written to the Kafka topic.
If the broker had failed right before it sent the ack but after the message was successfully written to the Kafka topic, this retry leads to the message being written twice and hence delivered more than once to the end consumer. And everybody loves a cheerful giver, but this approach can lead to duplicated work and incorrect results.
-
At-most-once semantics:
If the producer does not retry when an ack times out or returns an error, then the message might end up not being written to the Kafka topic, and hence not delivered to the consumer.
In most cases it will be, but in order to avoid the possibility of duplication, we accept that sometimes messages will not get through.
-
Exactly-once semantics:
Even if a producer retries sending a message, it leads to the message being delivered exactly once to the end consumer.
Exactly-once semantics is the most desirable guarantee, but also a poorly understood one. Because it requires a cooperation between the messaging system itself and the application producing and consuming the messages.
For instance, if after consuming a message successfully you rewind your Kafka consumer to a previous offset, you will receive all the messages from that offset to the latest one, all over again. This shows why the messaging system and the client application must cooperate to make exactly-once semantics happen.
4.4. What is Confluent Platform?
Confluent Platform is a full-scale data streaming platform that enables you to easily access, store, and manage data as continuous, real-time streams. Built by the original creators of Apache Kafka®, Confluent expands the benefits of Kafka with enterprise-grade features while removing the burden of Kafka management or monitoring.
| Confluent Platform | Apache Kafka® | Release Date | Standard End of Support | Platinum End of Support |
|---|---|---|---|---|
7.5.x |
3.5.x |
August 25, 2023 |
August 25, 2025 |
August 25, 2026 |
7.4.x |
3.4.x |
May 3, 2023 |
May 3, 2025 |
May 3, 2026 |
4.5. What ports does Kafka use?
The default ports used for Kafka and for services in the Kafka ecosystem are as follows:
| Service | Default Port |
|---|---|
Kafka Clients |
9092 |
Kafka Control Plane |
9093 |
ZooKeeper |
2181 |
Kafka Connect |
8083 |
Schema Registry |
8081 |
REST Proxy |
8082 |
ksqlDB |
8088 |
By default Kafka listens for client connections on port 9092. The listeners configuration is used to configure different or additional client ports. For more details on configuring Kafka listeners for access across networks see this blog about advertised.listeners.
-
Start the Kafka broker with the
-doption to run in detached mode:version: "2.4" services: broker: # https://raw.githubusercontent.com/confluentinc/cp-all-in-one/7.5.2-post/cp-all-in-one-kraft/docker-compose.yml image: confluentinc/cp-kafka:7.5.3 hostname: broker container_name: broker ports: - "9092:9092" - "9101:9101" environment: KAFKA_NODE_ID: 1 KAFKA_LISTENER_SECURITY_PROTOCOL_MAP: 'CONTROLLER:PLAINTEXT,PLAINTEXT:PLAINTEXT,PLAINTEXT_HOST:PLAINTEXT' KAFKA_ADVERTISED_LISTENERS: 'PLAINTEXT://broker:29092,PLAINTEXT_HOST://localhost:9092' KAFKA_OFFSETS_TOPIC_REPLICATION_FACTOR: 1 KAFKA_GROUP_INITIAL_REBALANCE_DELAY_MS: 0 KAFKA_TRANSACTION_STATE_LOG_MIN_ISR: 1 KAFKA_TRANSACTION_STATE_LOG_REPLICATION_FACTOR: 1 KAFKA_JMX_PORT: 9101 KAFKA_JMX_HOSTNAME: localhost KAFKA_PROCESS_ROLES: 'broker,controller' KAFKA_CONTROLLER_QUORUM_VOTERS: '1@broker:29093' KAFKA_LISTENERS: 'PLAINTEXT://broker:29092,CONTROLLER://broker:29093,PLAINTEXT_HOST://0.0.0.0:9092' KAFKA_INTER_BROKER_LISTENER_NAME: 'PLAINTEXT' KAFKA_CONTROLLER_LISTENER_NAMES: 'CONTROLLER' KAFKA_LOG_DIRS: '/tmp/kraft-combined-logs' # Replace CLUSTER_ID with a unique base64 UUID using "bin/kafka-storage.sh random-uuid" # See https://docs.confluent.io/kafka/operations-tools/kafka-tools.html#kafka-storage-sh CLUSTER_ID: 'MkU3OEVBNTcwNTJENDM2Qk'$ docker-compose up -d [+] Running 1/1 ✔ Container broker StartedThe Apache Kafka community has decided to move away from using ZooKeeper and create its own internal, built-in consensus and coordination layer, in a project known as KRaft (Kafka Raft Metadata mode) or KRaft mode. -
Open a terminal session and run in the broker container:
$ docker exec -it broker bash -
Create a topic to store your events
$ kafka-topics --create --topic quickstart-events --bootstrap-server localhost:9092 Created topic quickstart-events. $ kafka-topics --describe --topic quickstart-events --bootstrap-server localhost:9092 Topic: quickstart-events TopicId: cQ9KYWsUScyxvdrcHsQ8tg PartitionCount: 1 ReplicationFactor: 1 Configs: Topic: quickstart-events Partition: 0 Leader: 1 Replicas: 1 Isr: 1 -
Write some events into the topic
$ kafka-console-producer --topic quickstart-events --bootstrap-server localhost:9092
>This is my first event
>This is my second event
>^C
You can stop the producer client with
Ctrl-Cat any time. -
Read the events
$ kafka-console-consumer --topic quickstart-events --from-beginning --bootstrap-server localhost:9092
This is my first event
This is my second event
^CProcessed a total of 2 messages
You can stop the consumer client with
Ctrl-Cat any time.
5. References
-
Martin Kleppmann: Designing Data-Intensive Applications, O’Reilly, 2017.
-
What Is Apache Kafka?, https://developer.confluent.io/what-is-apache-kafka/
-
Apache Kafka, https://kafka.apache.org/documentation/
-
Apache Kafka, https://kafka.apache.org/08/documentation.html
-
Exactly-Once Semantics Are Possible: Here’s How Kafka Does It, https://www.confluent.io/blog/exactly-once-semantics-are-possible-heres-how-apache-kafka-does-it/
-
What is Confluent Platform, https://docs.confluent.io/platform/current/platform.html
-
Apache Kafka Quickstart, https://kafka.apache.org/quickstart
-
Quick Start for Confluent Platform, https://docs.confluent.io/platform/current/platform-quickstart.html